How Glue DataBrew Works
The workflow of Glue DataBrew is straightforward:- Create a Project: Establish a workspace to interact, analyze, explore, and perform data preparation tasks.
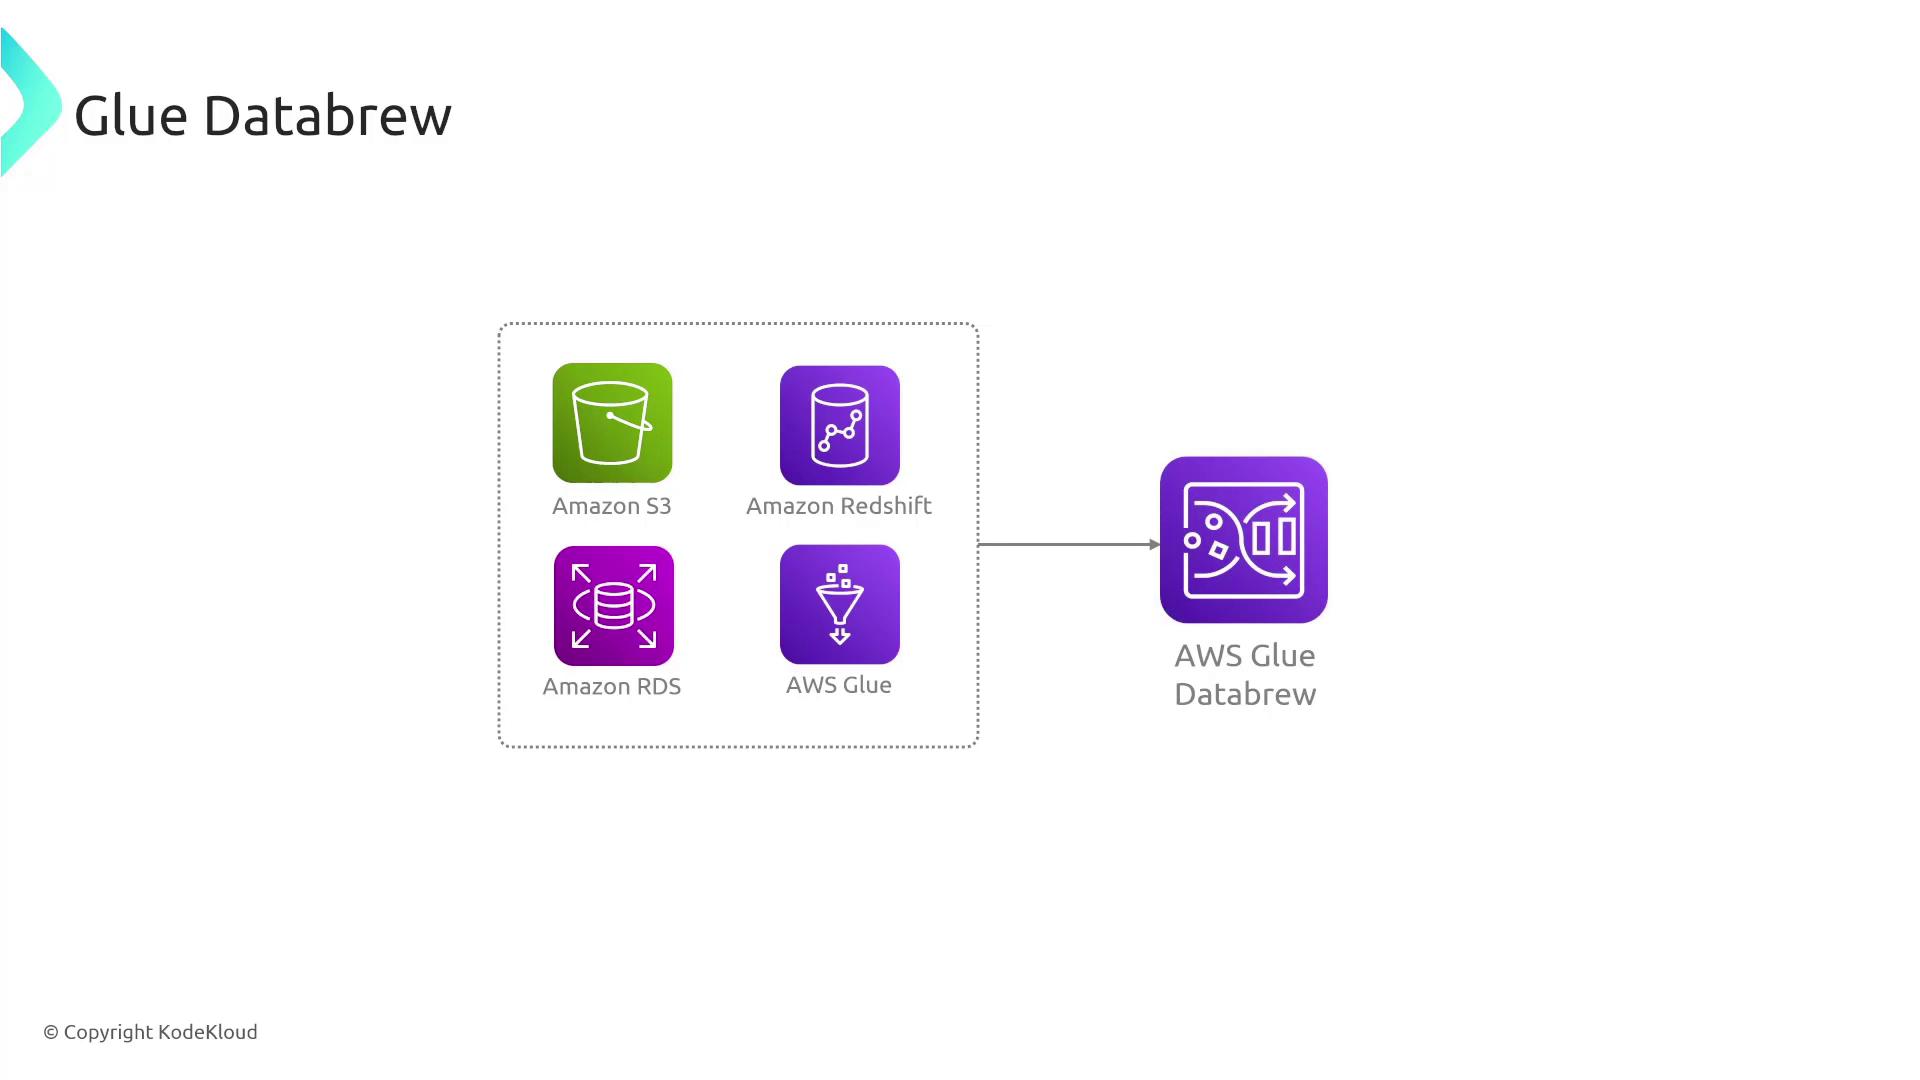
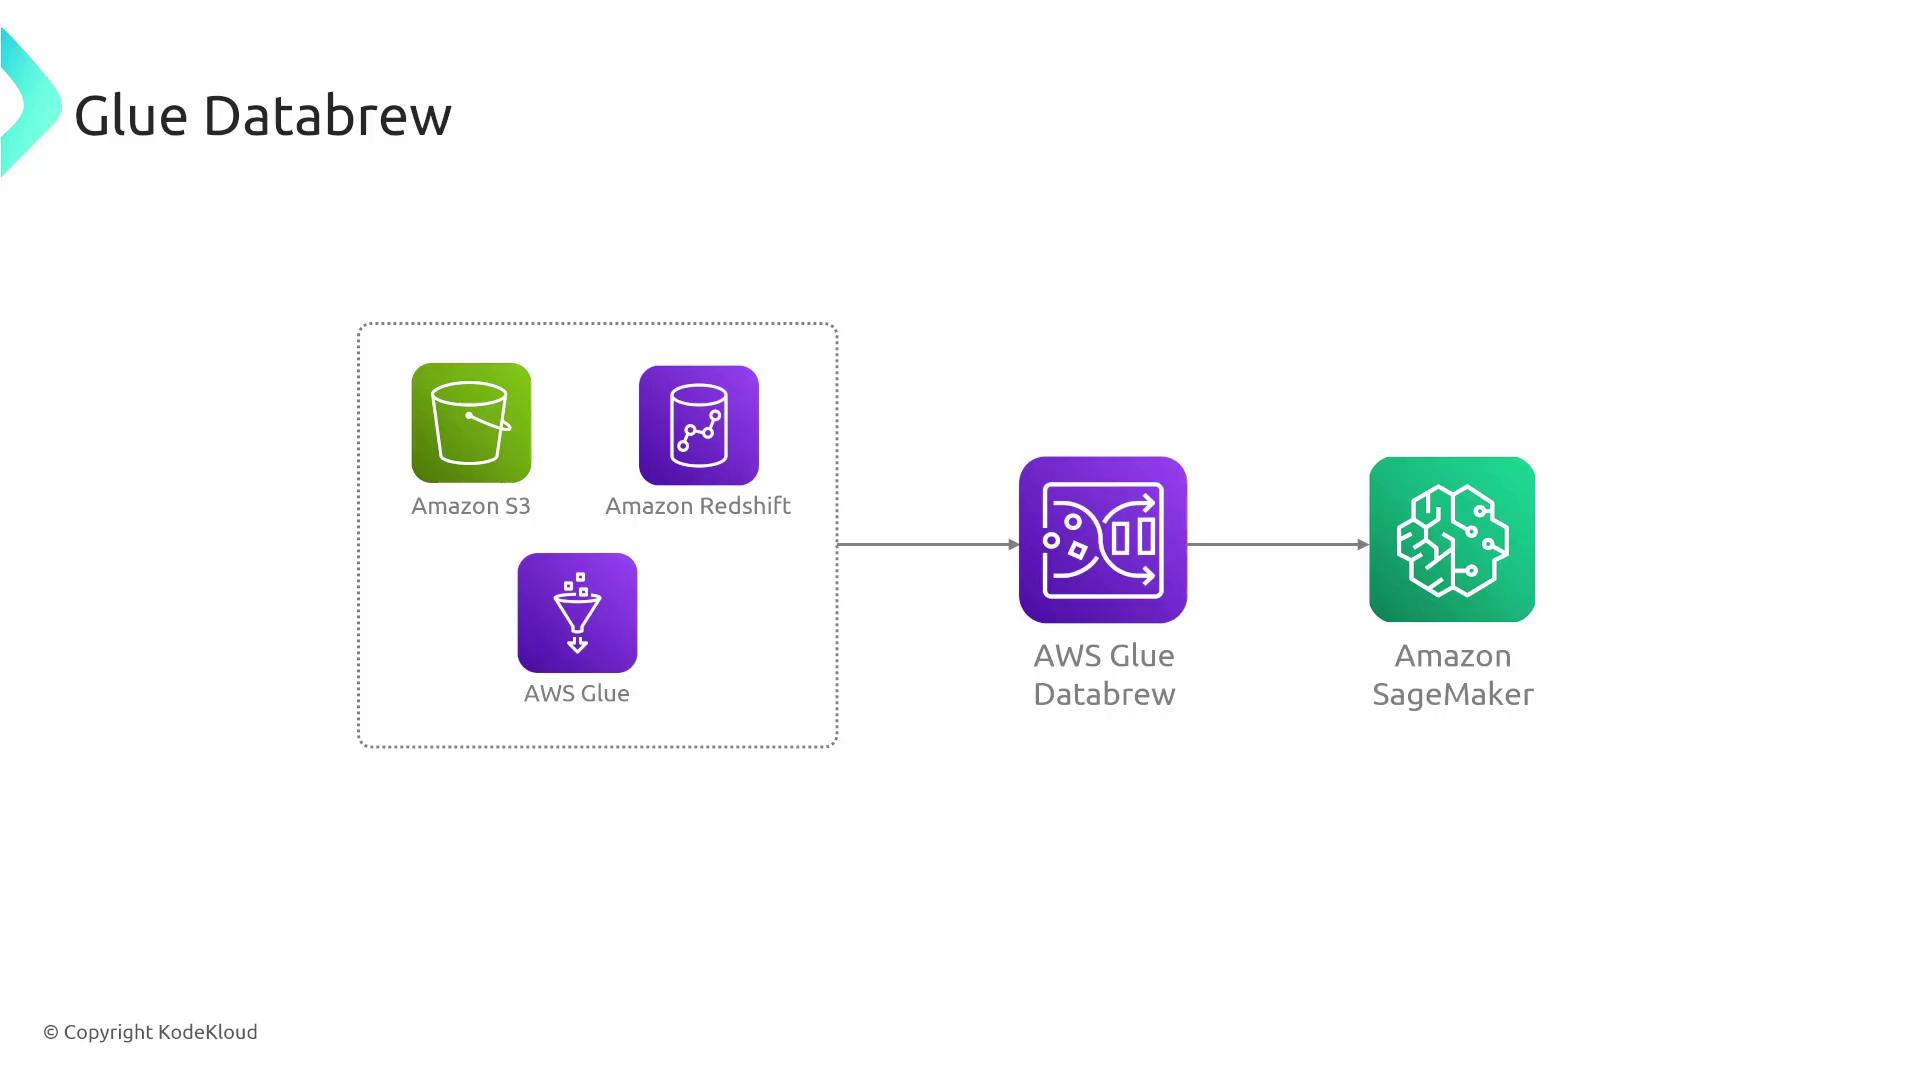
- Select Datasets and/or Data Sources: Import data from various sources such as S3, Redshift, or other services—similar to the process in Glue ETL.
- Choose Recipes: Recipes are sets of visual data transformation steps, including operations like filtering rows and converting data types (e.g., string to number). All operations are applied from an intuitive menu without the need for coding.
- Run the Recipe: When executed, DataBrew applies all specified transformations to the complete dataset. The processed data is then stored in Amazon S3 for consumption by other services.
One significant advantage of Glue DataBrew is its serverless nature. This means you do not need to manage, secure, or scale servers manually. Instead, operational aspects like monitoring are seamlessly handled via services such as CloudWatch.
Example Workflow
Consider a workflow where data is sourced from S3 and ingested into Glue DataBrew. It leverages pre-built transformations, and the output is subsequently loaded into Athena. The processed data then becomes accessible to QuickSight for analysis by data and business analysts.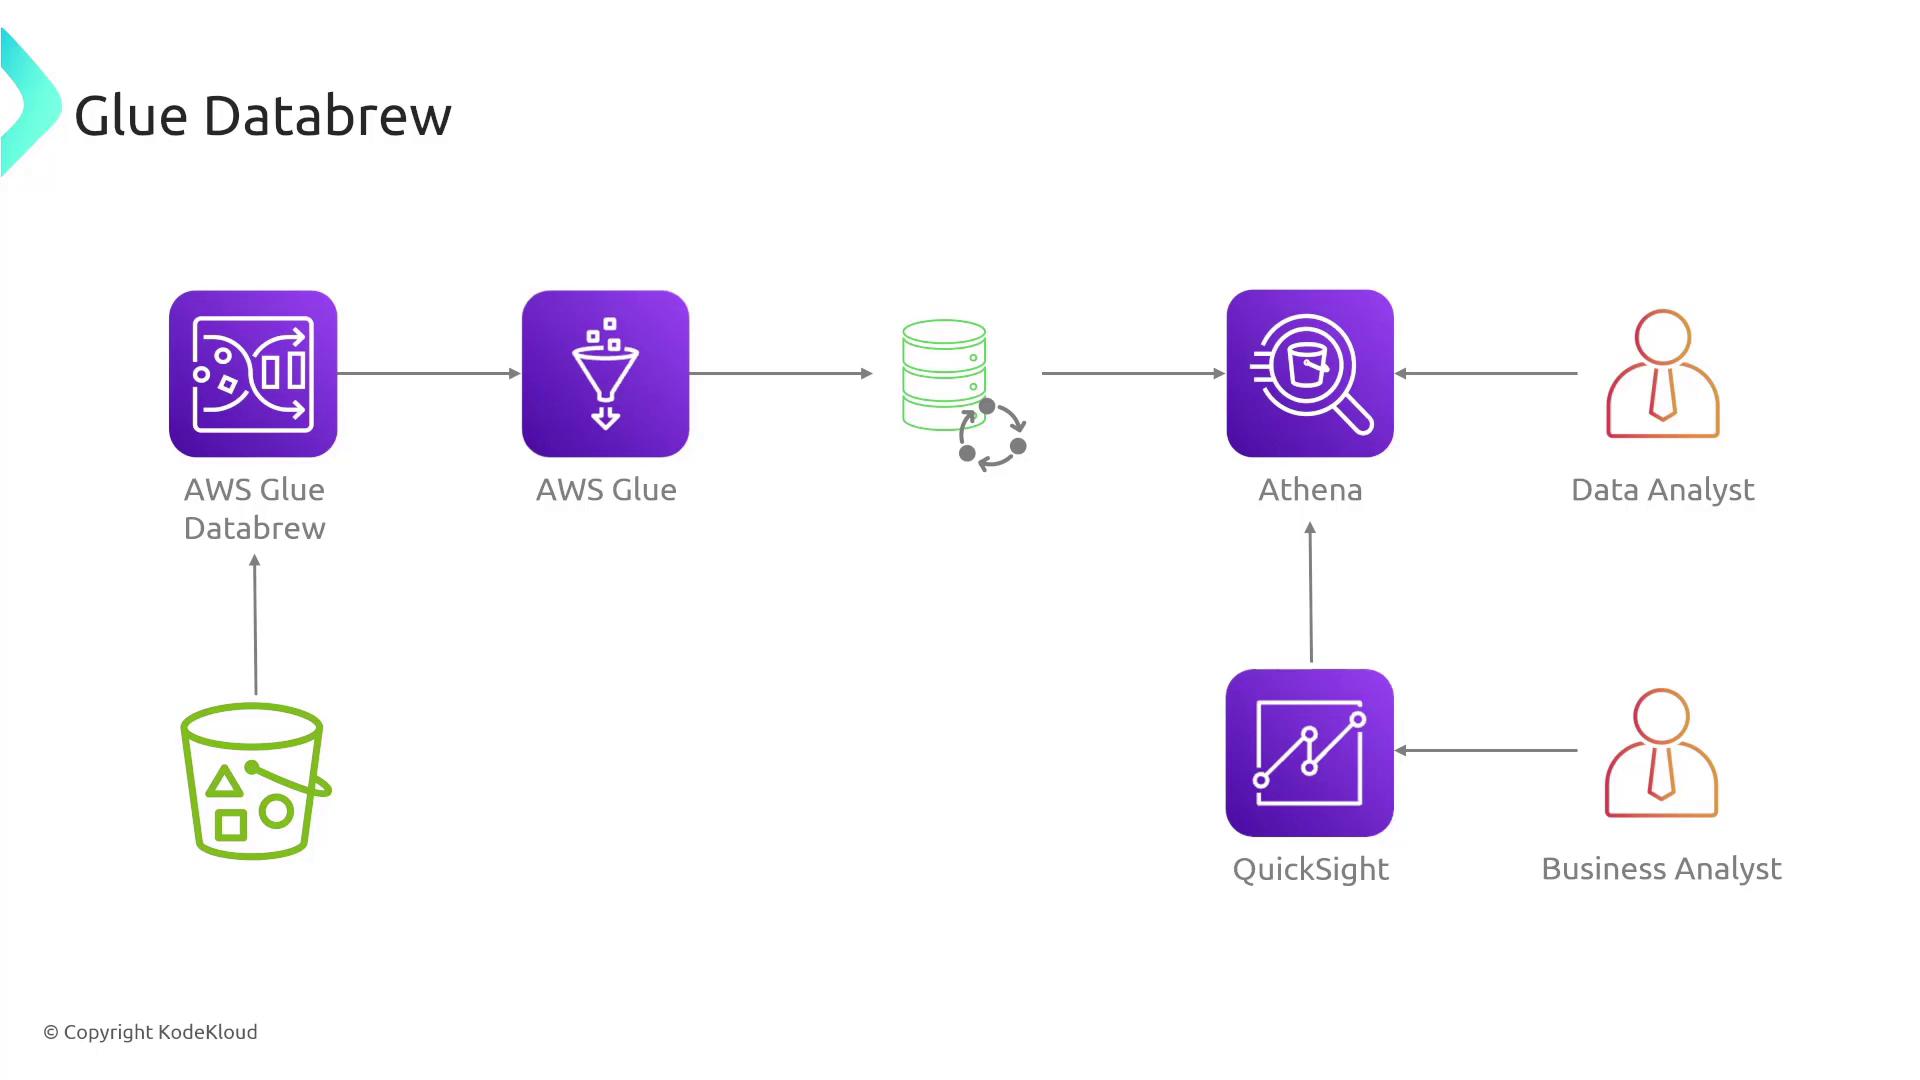
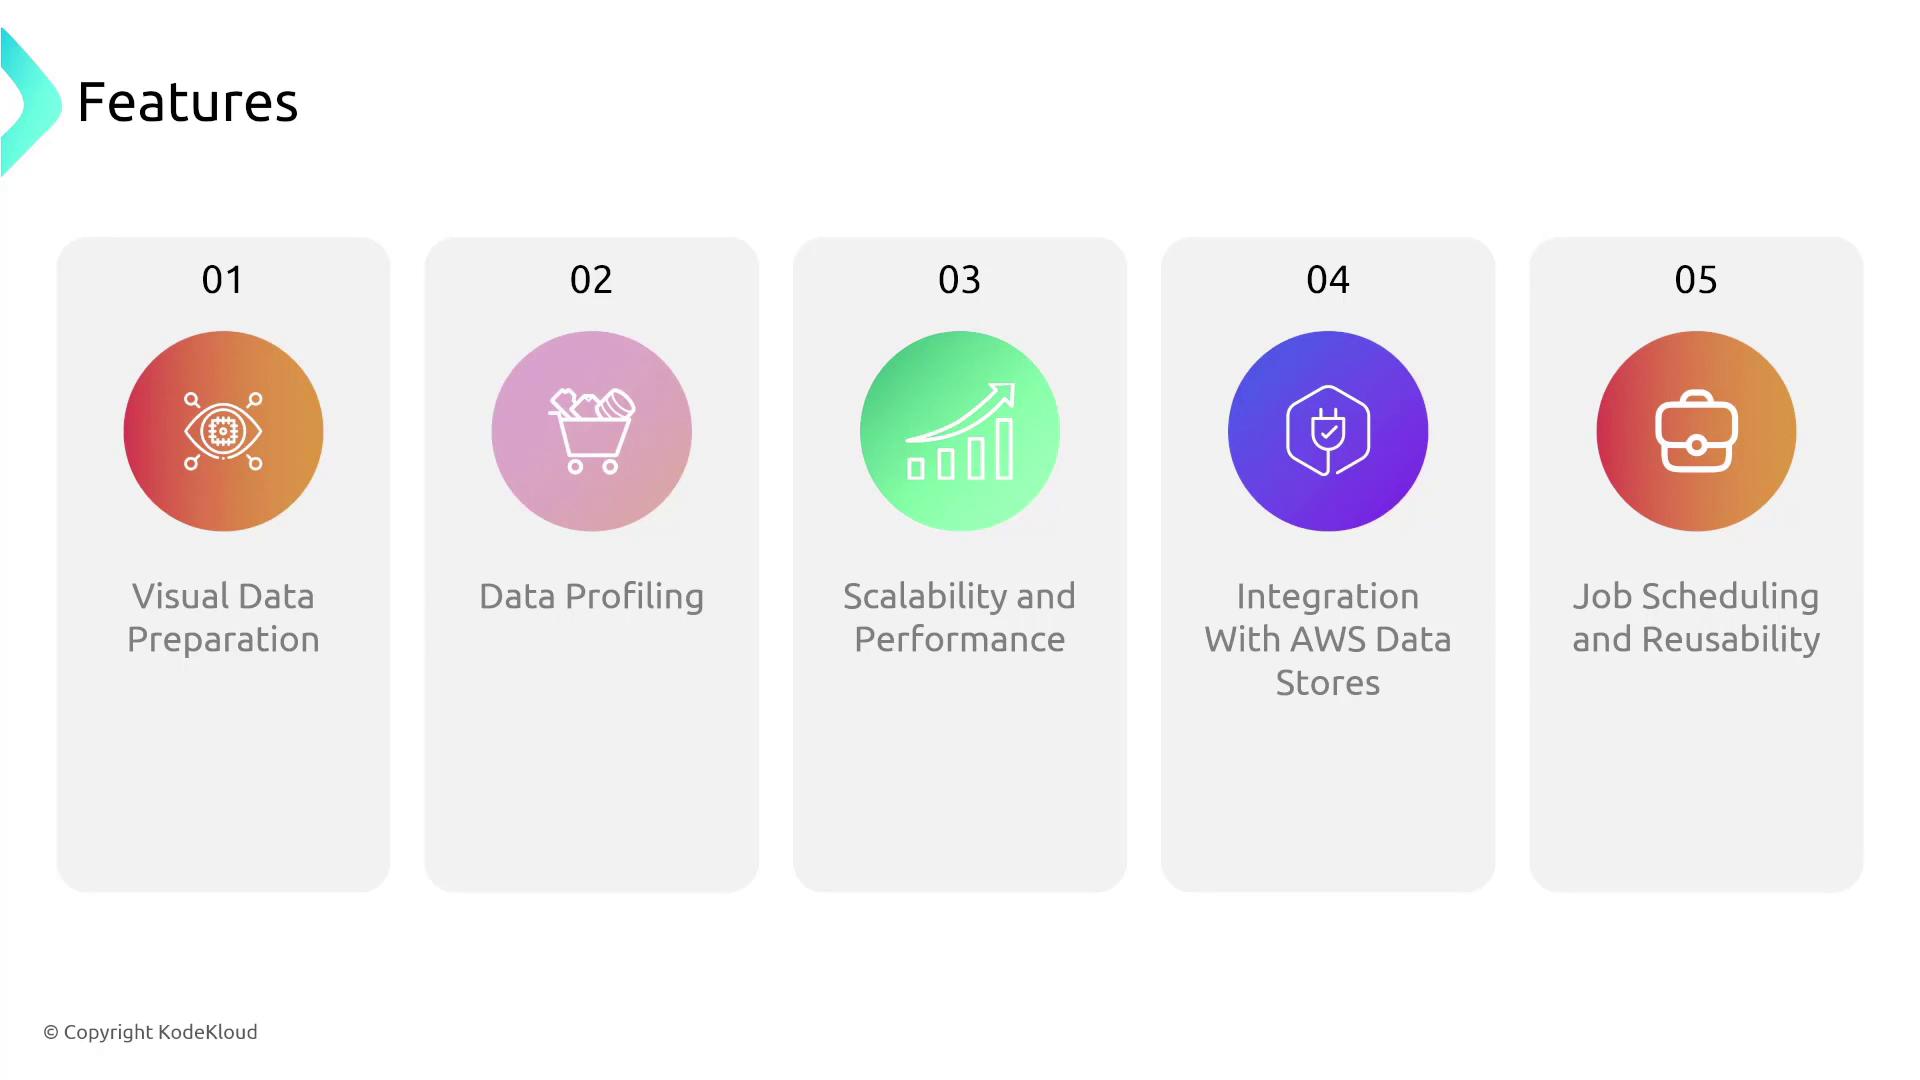
Key Features of Glue DataBrew
| Feature | Description |
|---|---|
| Visual Data Preparation | Clean and transform data through an intuitive graphical interface—no coding required. |
| Data Profiling | Automatically generate metadata statistics to identify outliers, anomalies, missing values, and inconsistencies. |
| Scalability | Automatically scales with your data preparation workload without manual intervention. |
| Integration with AWS Data Stores | Seamlessly integrates with services such as Aurora, Redshift, and RDS. |
| Job Scheduling and Reusability | Schedule data tasks based on triggers or time, and create reusable project templates. |