

This lesson highlights operational controls you can turn to increase reliability: cross‑AZ deployment, health checks, autoscaling policies, throttling and retries, dead‑letter queues (DLQs), and centralized observability (CloudWatch, access logs, VPC Flow Logs).
Auto Scaling and Load Balancers
Auto Scaling complements load balancers to provide automated recovery and elastic capacity. A typical pattern is a virtual front-end (an Application Load Balancer or other load balancer) distributing traffic across an Auto Scaling group of instances in multiple Availability Zones (AZs).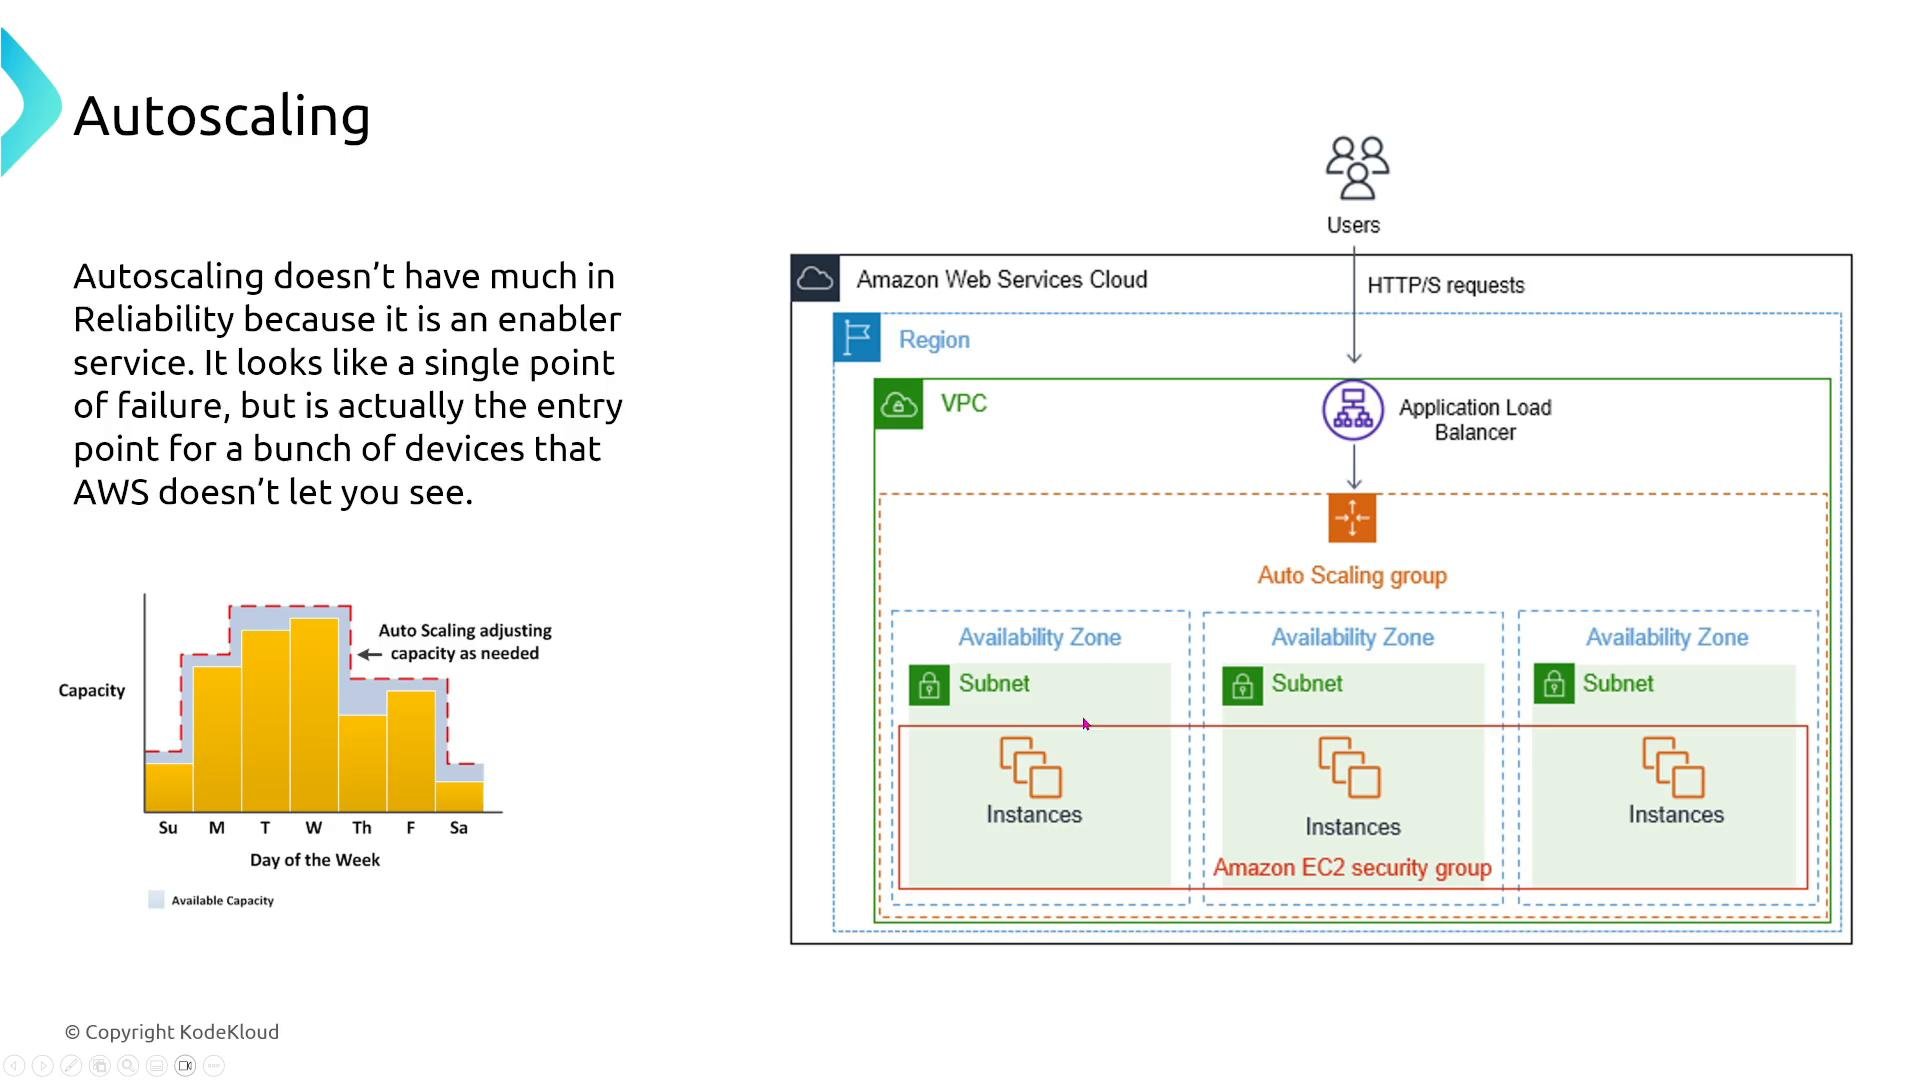
- Automated recovery: when an instance fails, Auto Scaling launches a replacement based on the configured launch template or configuration.
- High availability: distribute instances across multiple AZs so capacity can be restored in other AZs if one AZ degrades.
- Loose coupling: a load-balancing abstraction decouples clients from instance lifecycles and enables rolling updates with minimal client impact.
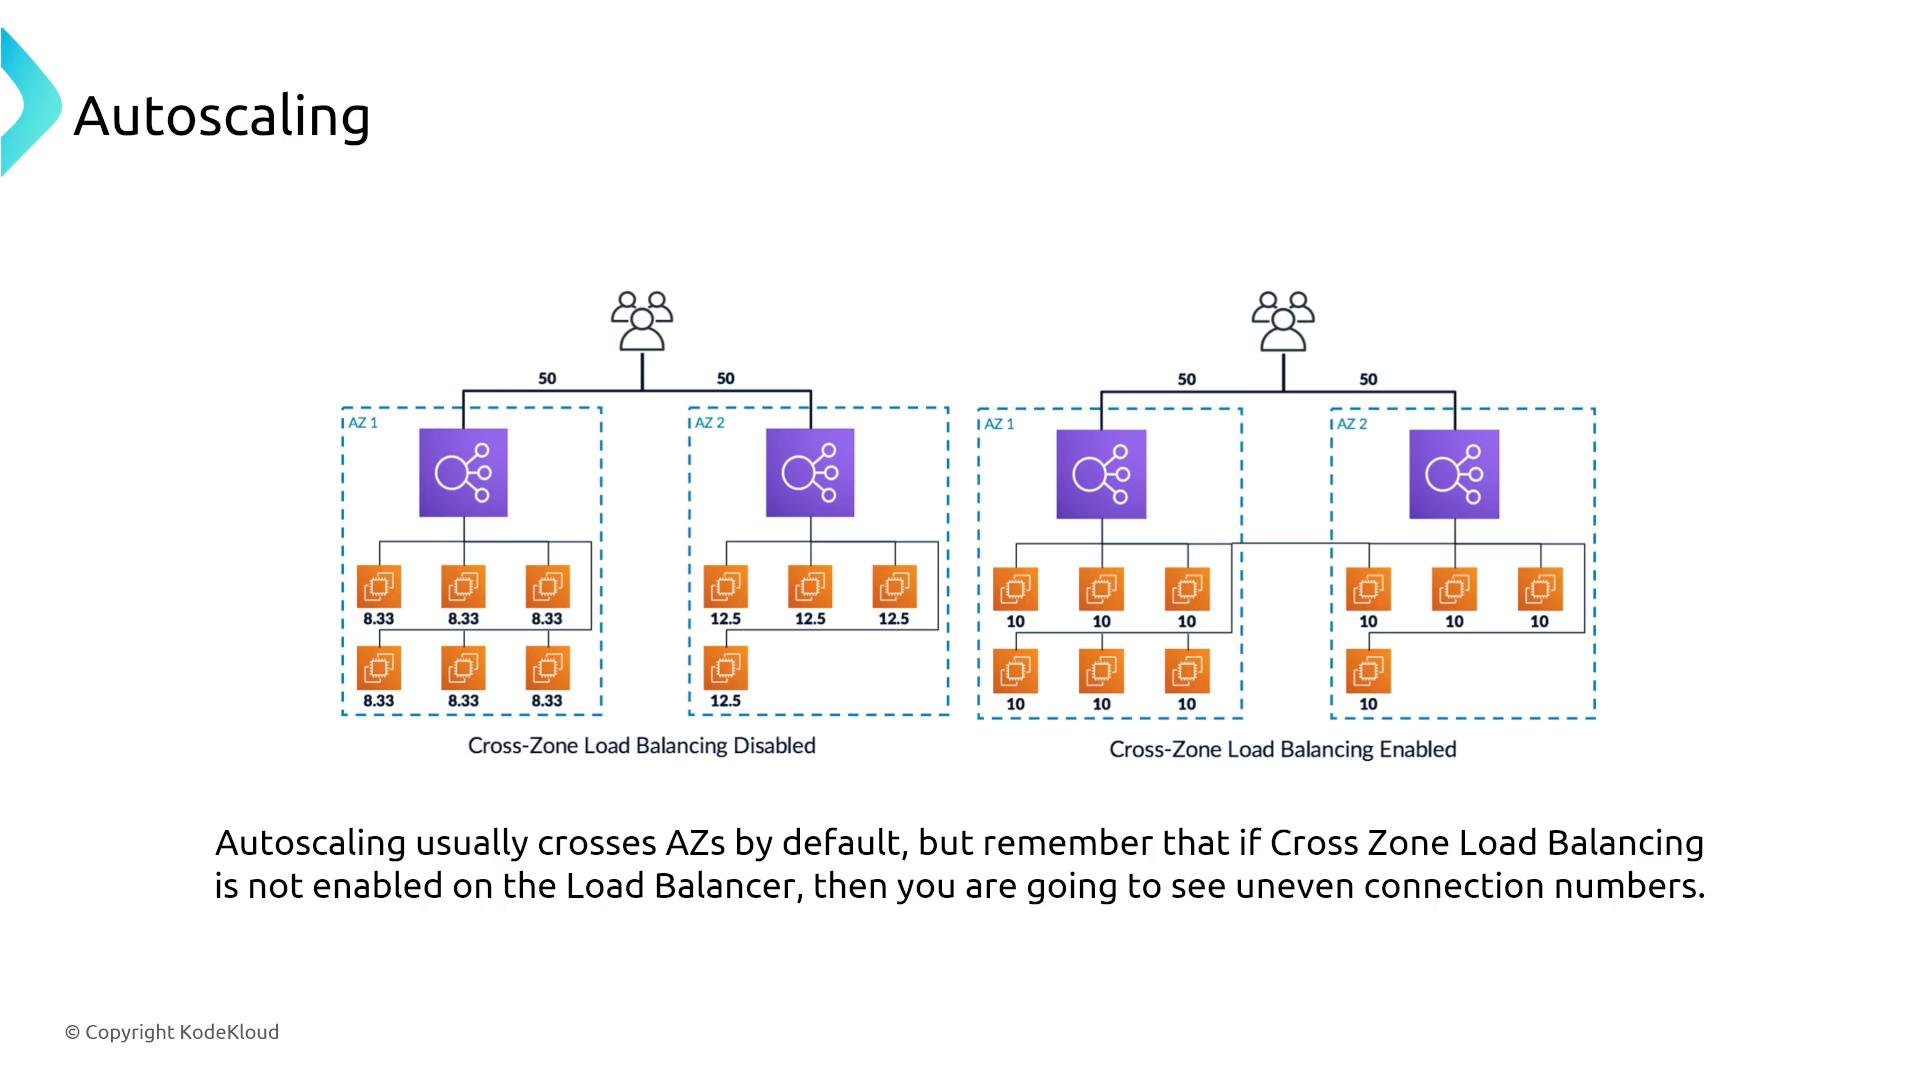
- Enable cross-zone load balancing when you need even traffic distribution across AZs. ALB and NLB defaults and behaviors can vary by region and account — verify the behavior in your environment.
- Tune Auto Scaling policies (target tracking, step/dynamic, predictive) to control responsiveness and cost. Target tracking is often simplest; predictive scaling works well for predictable traffic patterns.
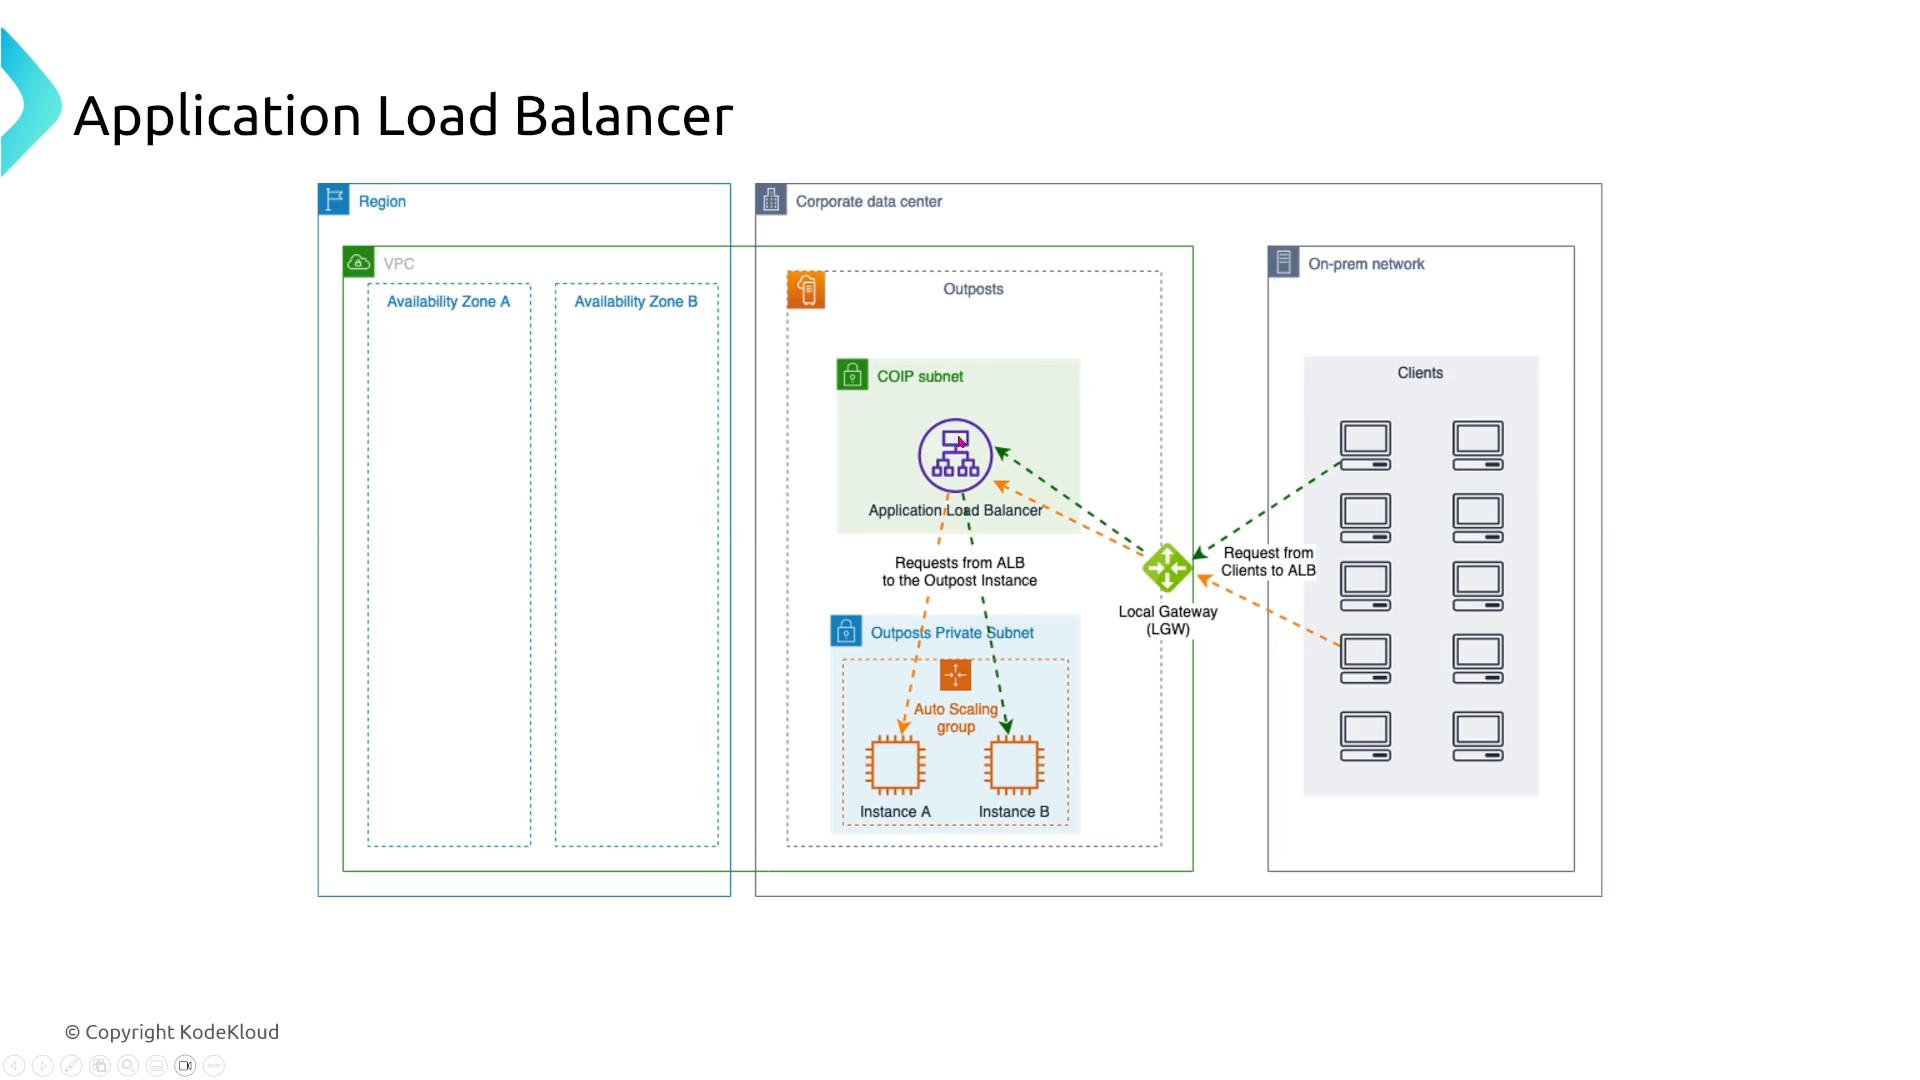
Application Load Balancer (ALB)
- ALB routes HTTP/HTTPS traffic using listener rules and target groups; use path or host-based routing to split traffic to different backends.
- Configure target group health checks (path, timeout, healthy/unhealthy thresholds) so ALB can stop sending traffic to unhealthy targets.
- Span Auto Scaling groups across multiple AZs to allow instance replacement in other AZs during AZ-level failures.
- Use ALB access logs (delivered to S3) and CloudWatch metrics to analyze request paths, client IPs, response codes, and latencies.
- ALB can terminate TLS, reducing backend CPU and centralizing certificate management.
- Route different traffic types by using multiple listeners or listener rules (e.g., mobile vs. desktop paths).
- Combine
UnHealthyHostCountand latency metrics in CloudWatch to detect backend degradation early.
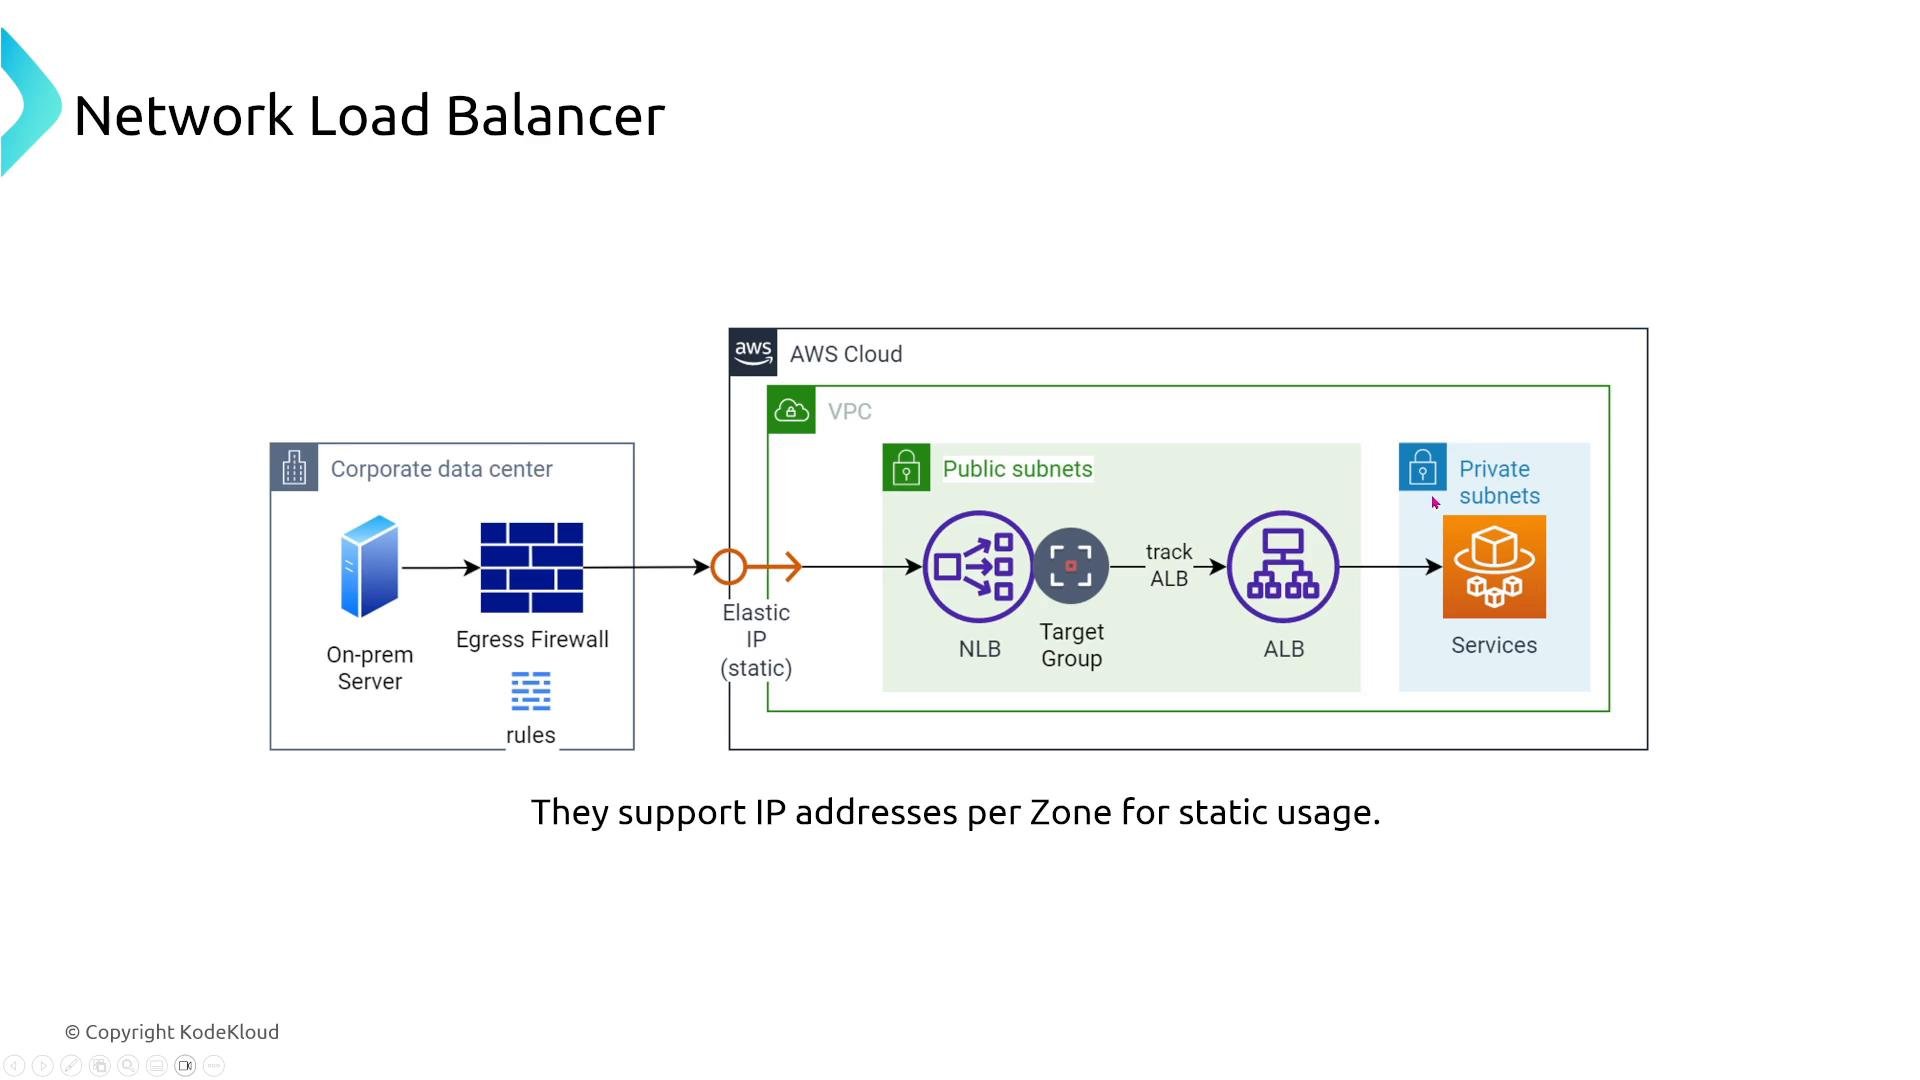
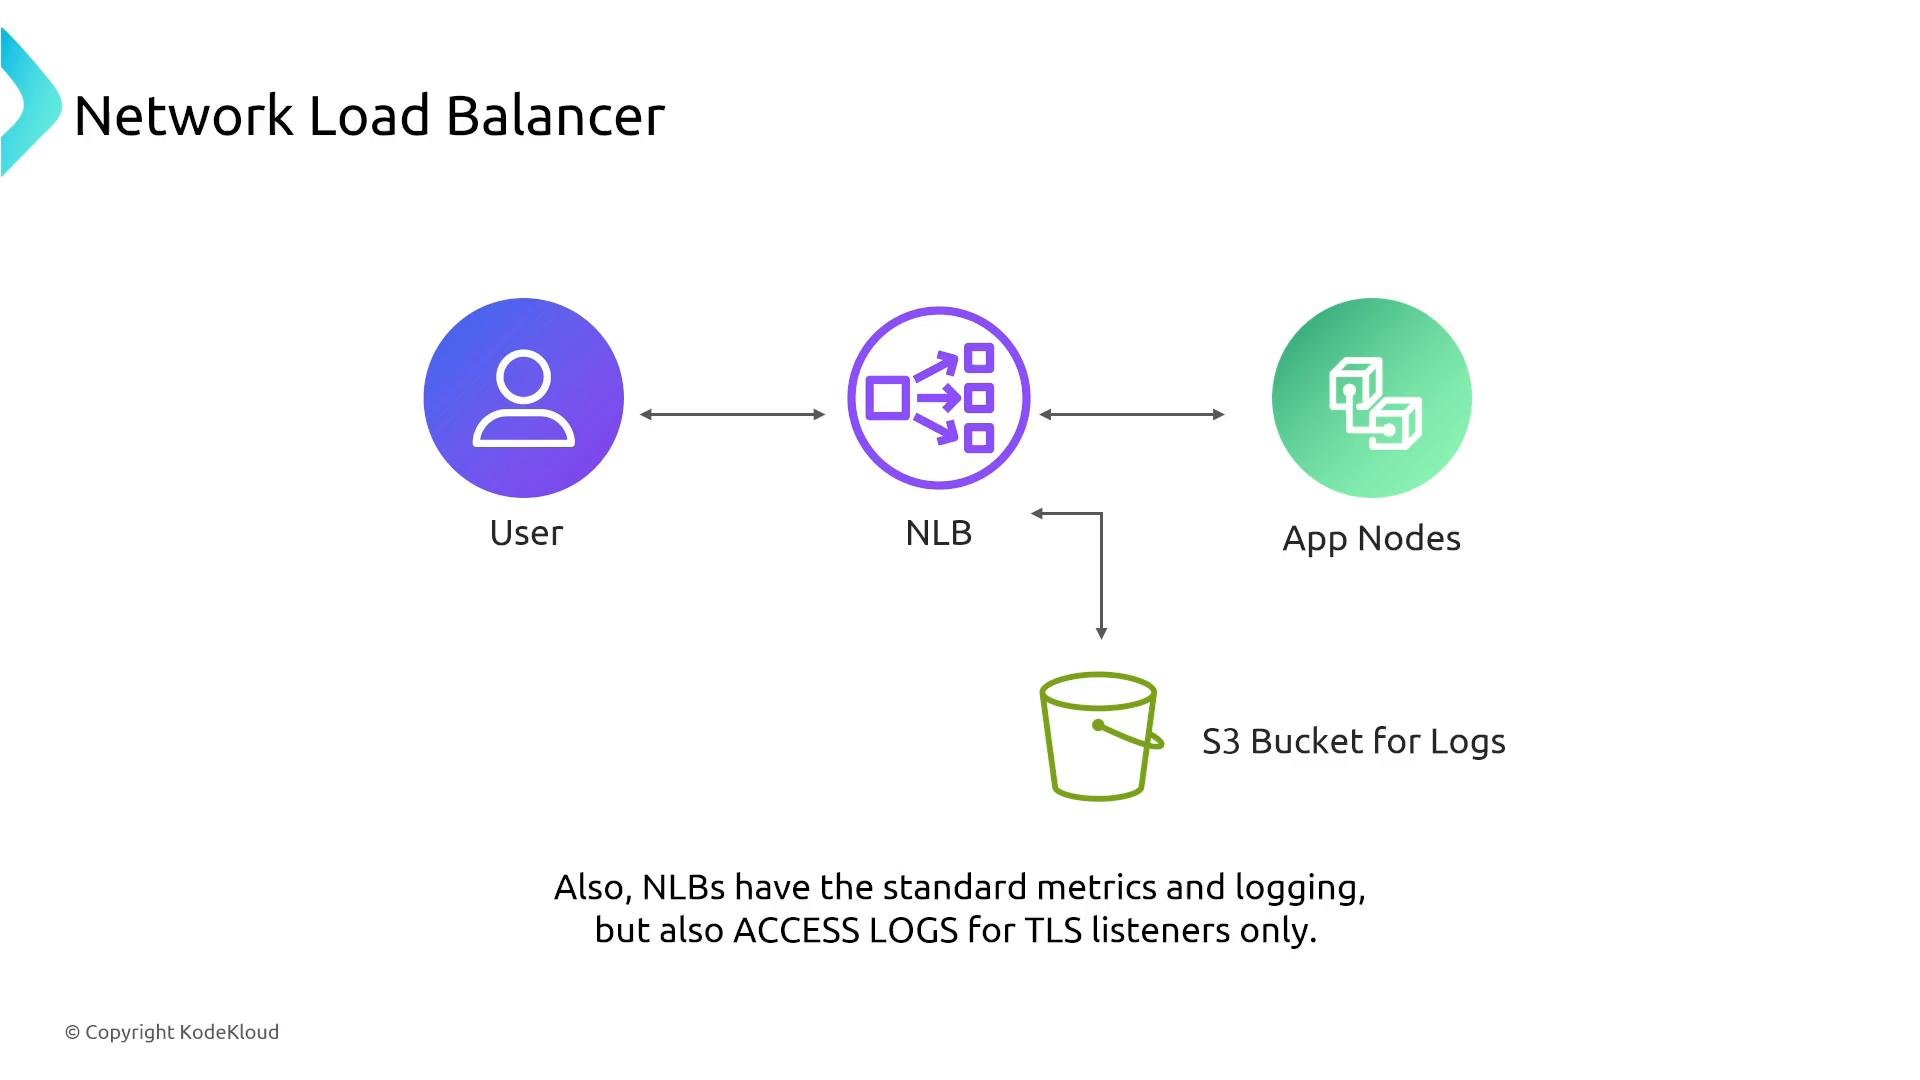
- NLB is optimized for ultra‑low latency and volatile workloads. It forwards traffic at the transport layer without path‑based routing.
- Use transport-level health checks (TCP/TLS/UDP) to verify reachability. For application‑level checks (HTTP semantics), prefer ALB target groups.
- NLB supports static Elastic IPs per AZ — valuable when you must whitelist IP addresses.
- Access log availability depends on listener protocols and settings — consult the NLB documentation for your configuration.
- Enable VPC Flow Logs on subnets or ENIs where you need IP‑level telemetry. Flow logs capture source/destination IPs and ports, protocol, packet/byte counts, and accept/reject decisions.
- Example VPC Flow Log lines:
- For TLS‑level insights, enable access logs where supported and inspect logs together with VPC Flow Logs for full packet- and request-level visibility.
- Use GWLB to insert virtual appliances (IDS/IPS, NGFW, DPI) into flows without changing source/destination semantics.
- Integrate GWLB with an Auto Scaling group of appliances. Ensure each appliance registers with the GWLB and responds to health checks so traffic is routed only to healthy appliances.
- GWLB exposes CloudWatch metrics and can be observed via CloudTrail and VPC Flow Logs.
API Gateway
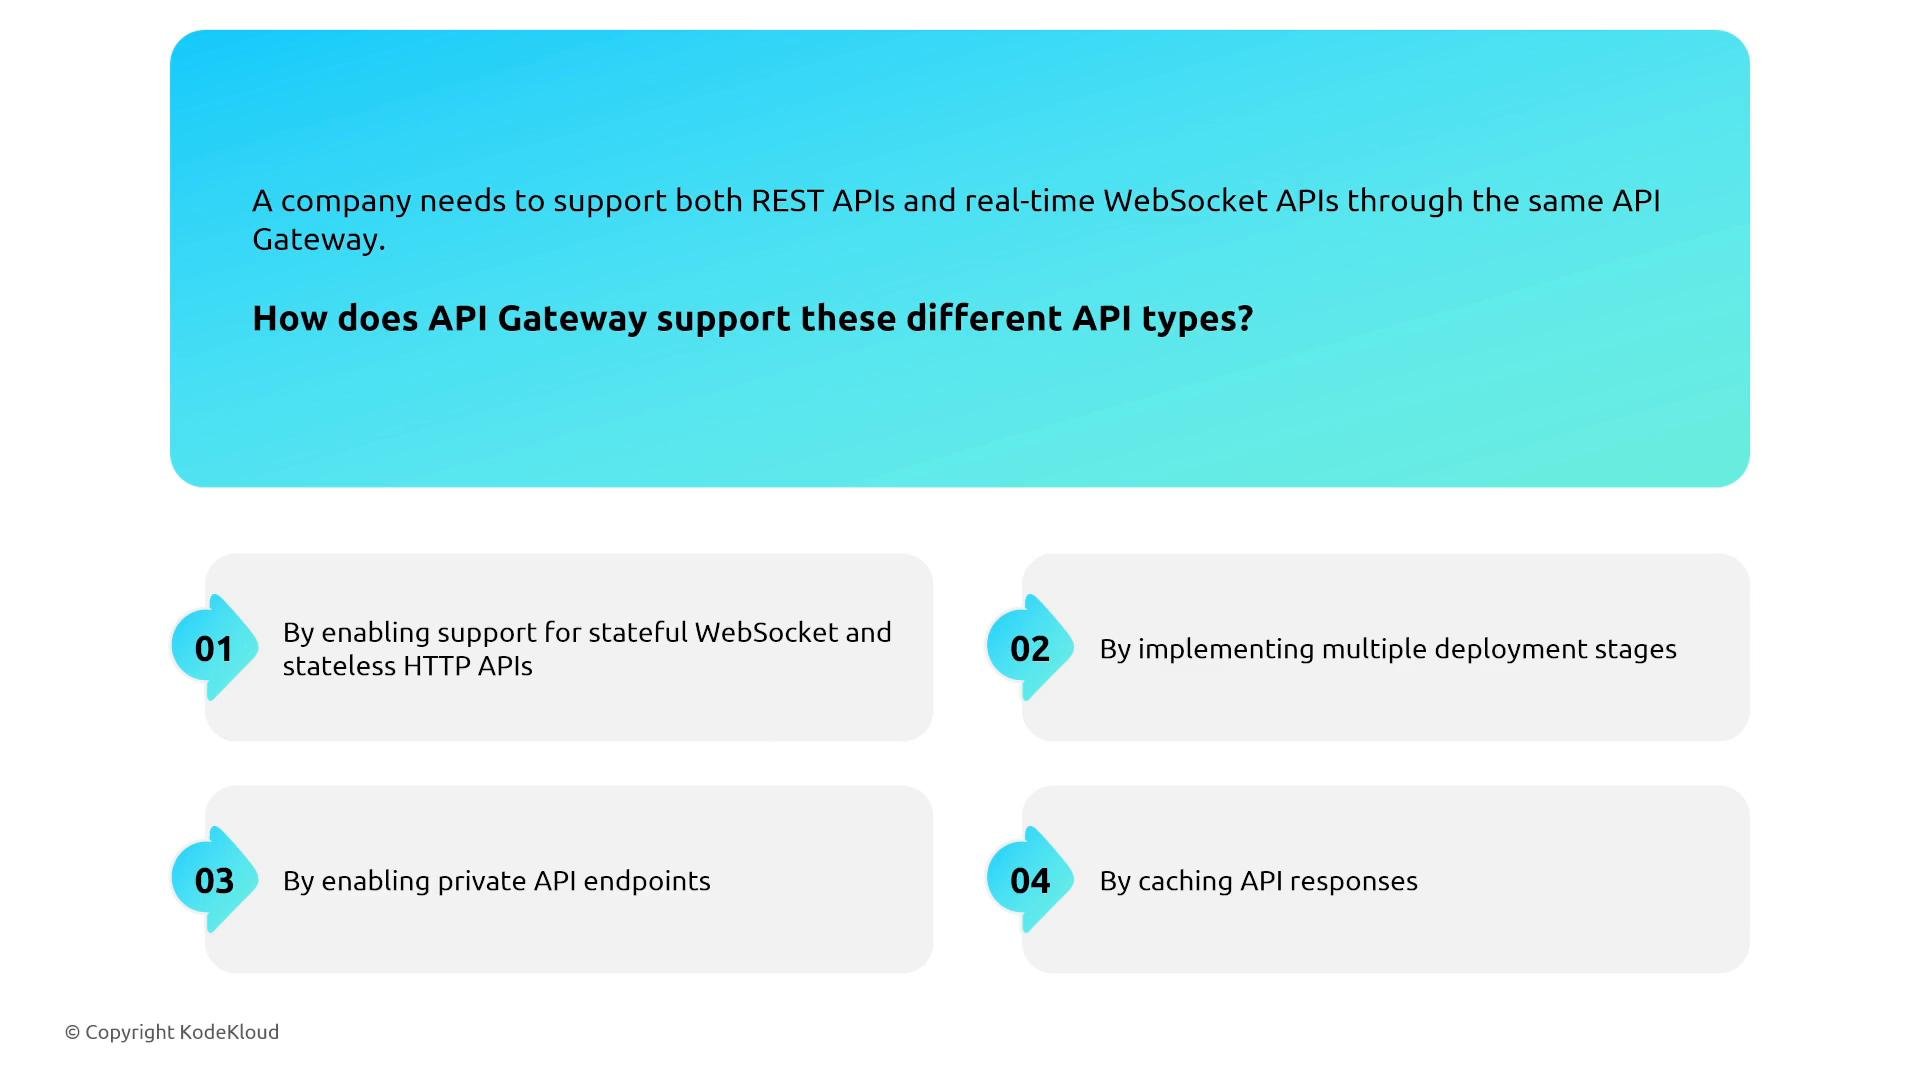
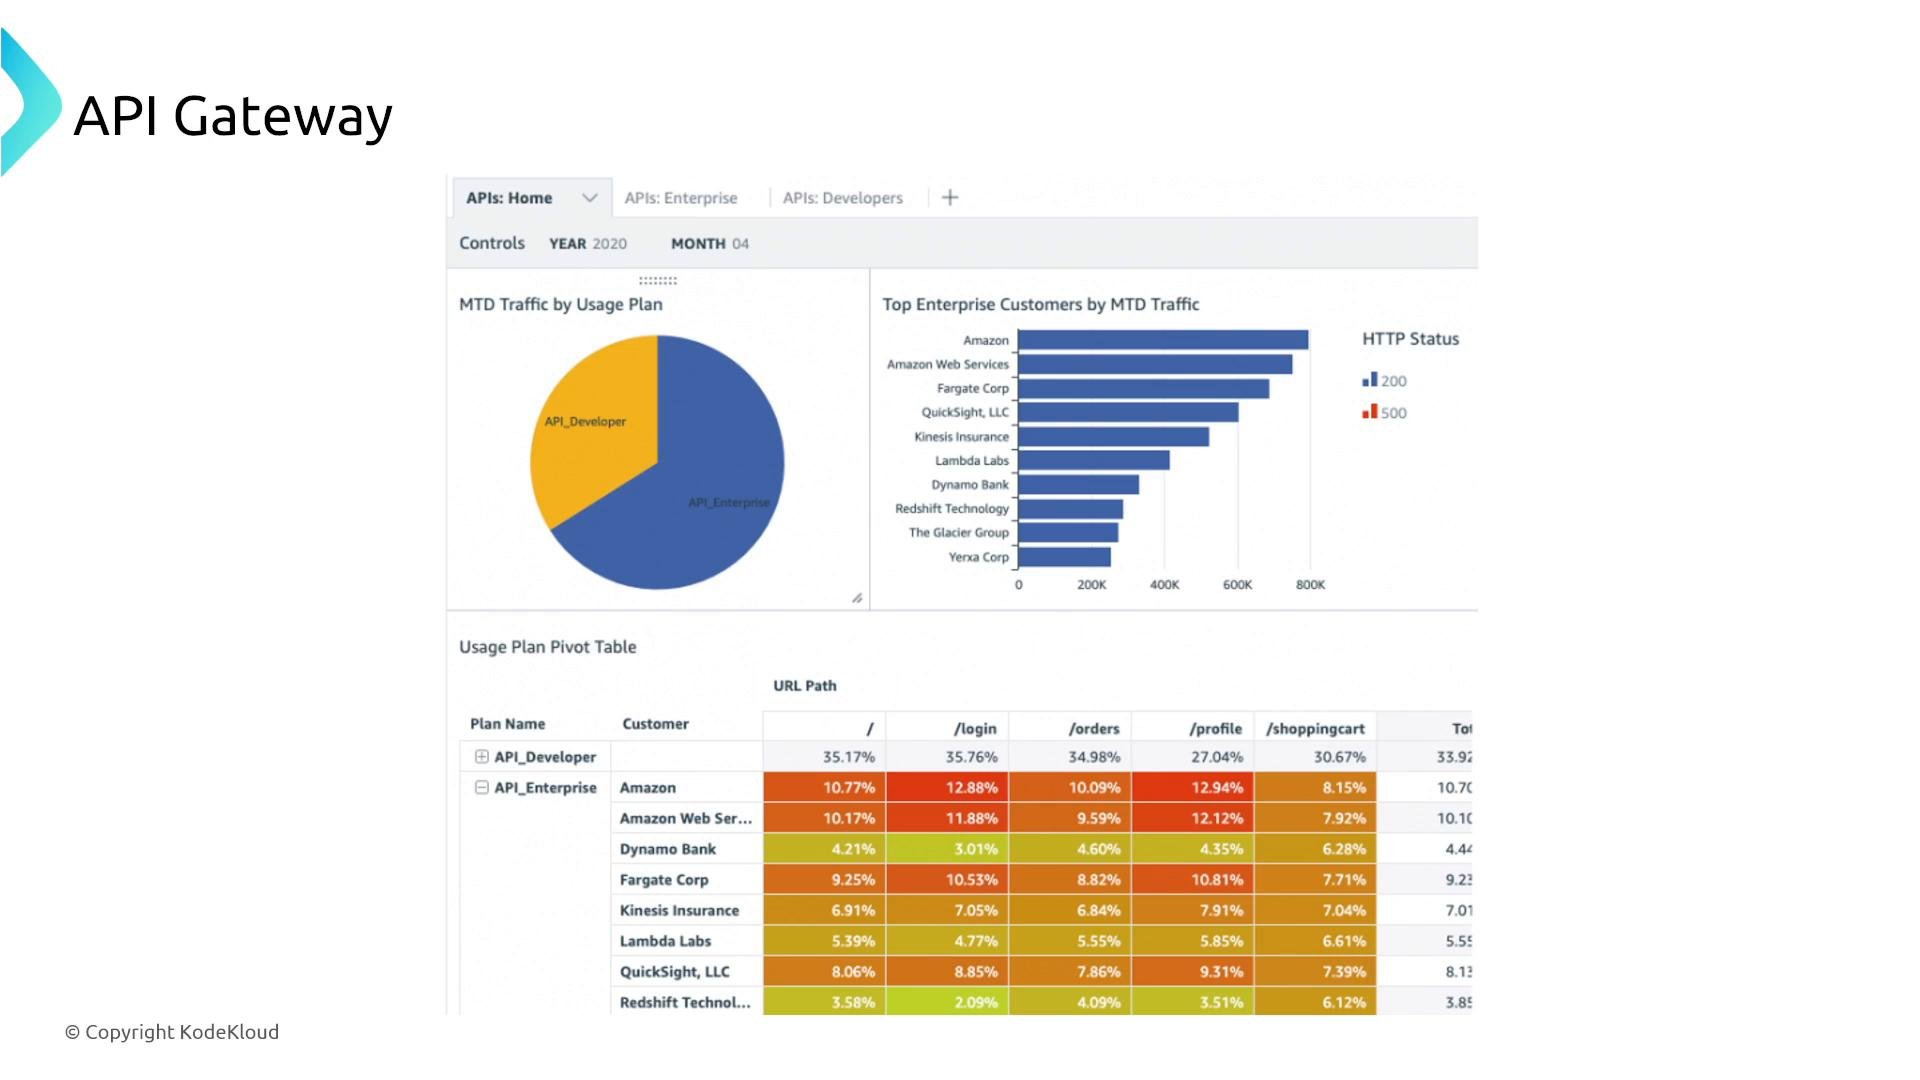
API Gateway provides managed REST, HTTP, and WebSocket API endpoints with built-in features for throttling, caching, validation, and staged deployments (including canary releases). Supporting REST and WebSocket APIs- Use separate API Gateway deployments or stages for REST/HTTP and WebSocket APIs because WebSocket APIs are stateful and long‑lived while REST is stateless.
- For security/latency reasons, you may use private API endpoints (VPC endpoints) for internal services.
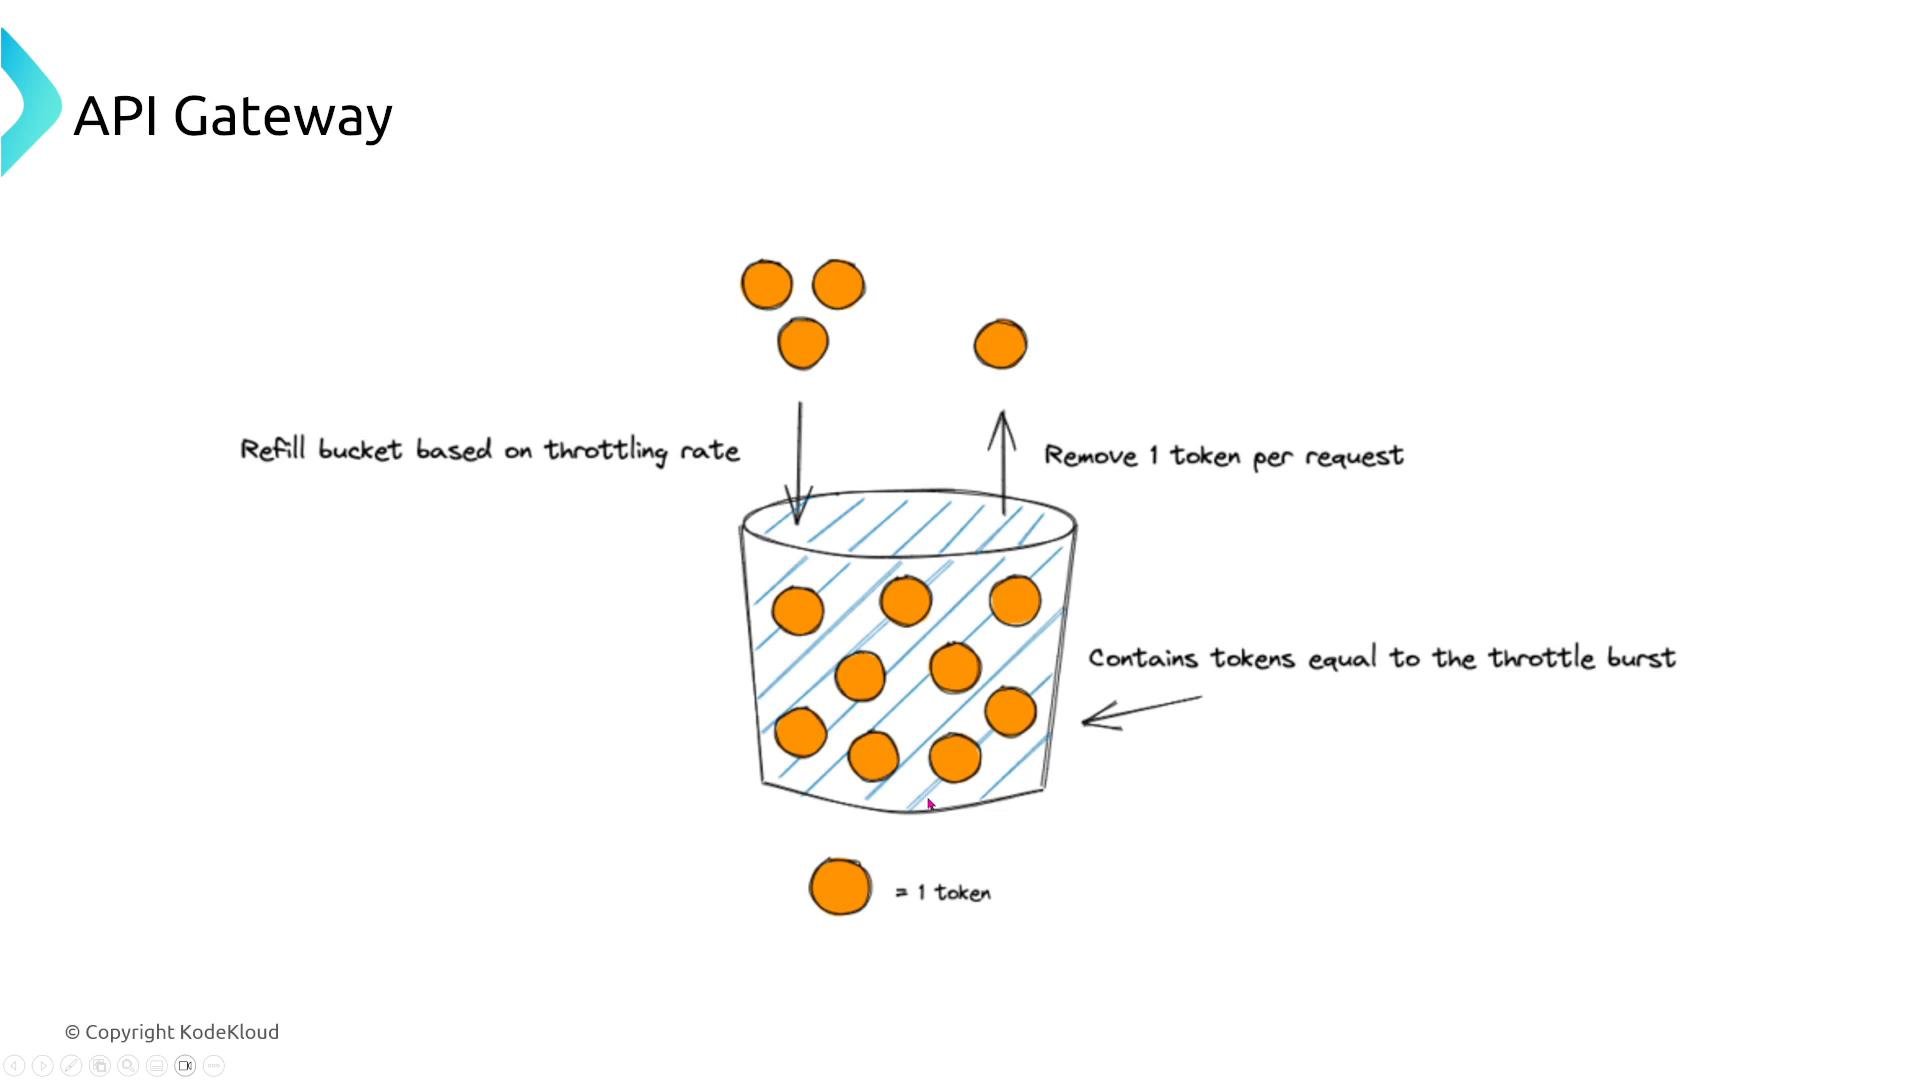
- API Gateway uses a token‑bucket model for throttling and burst handling. Apply per‑method and per‑stage throttling, and use usage plans with API keys for per‑consumer quotas.
- Protect backends by setting conservative default throttles and incrementally increasing limits based on observed load.
If you have bursty traffic or strict SLAs, configure throttling and backoff in clients. Uncontrolled bursts can exhaust backend resources even if the API Gateway throttles requests.
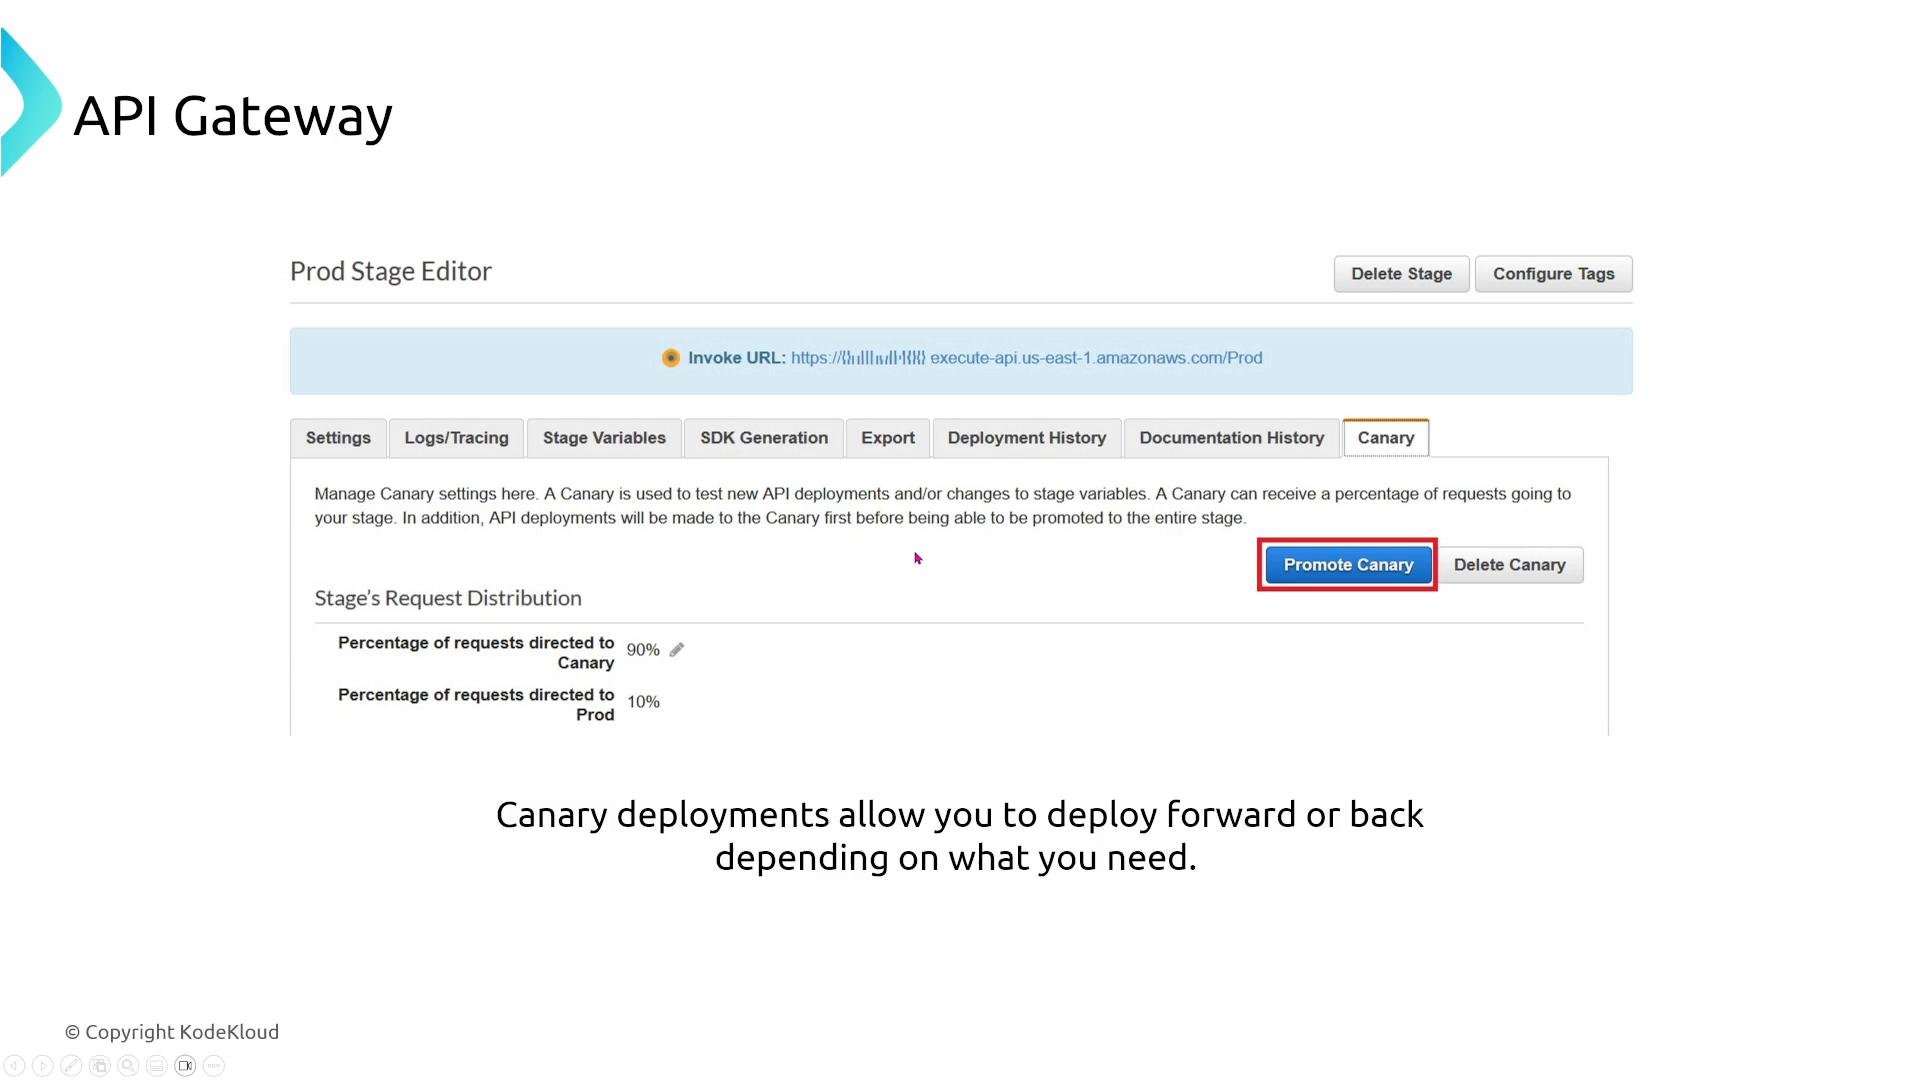
- Use staged canaries to route a percentage of traffic to a new deployment. Monitor execution metrics (latency, errors, integration latencies) in CloudWatch — promote or rollback based on thresholds.
- Use API Gateway execution metrics and logs to drive CloudWatch Alarms and dashboards.
AppFlow
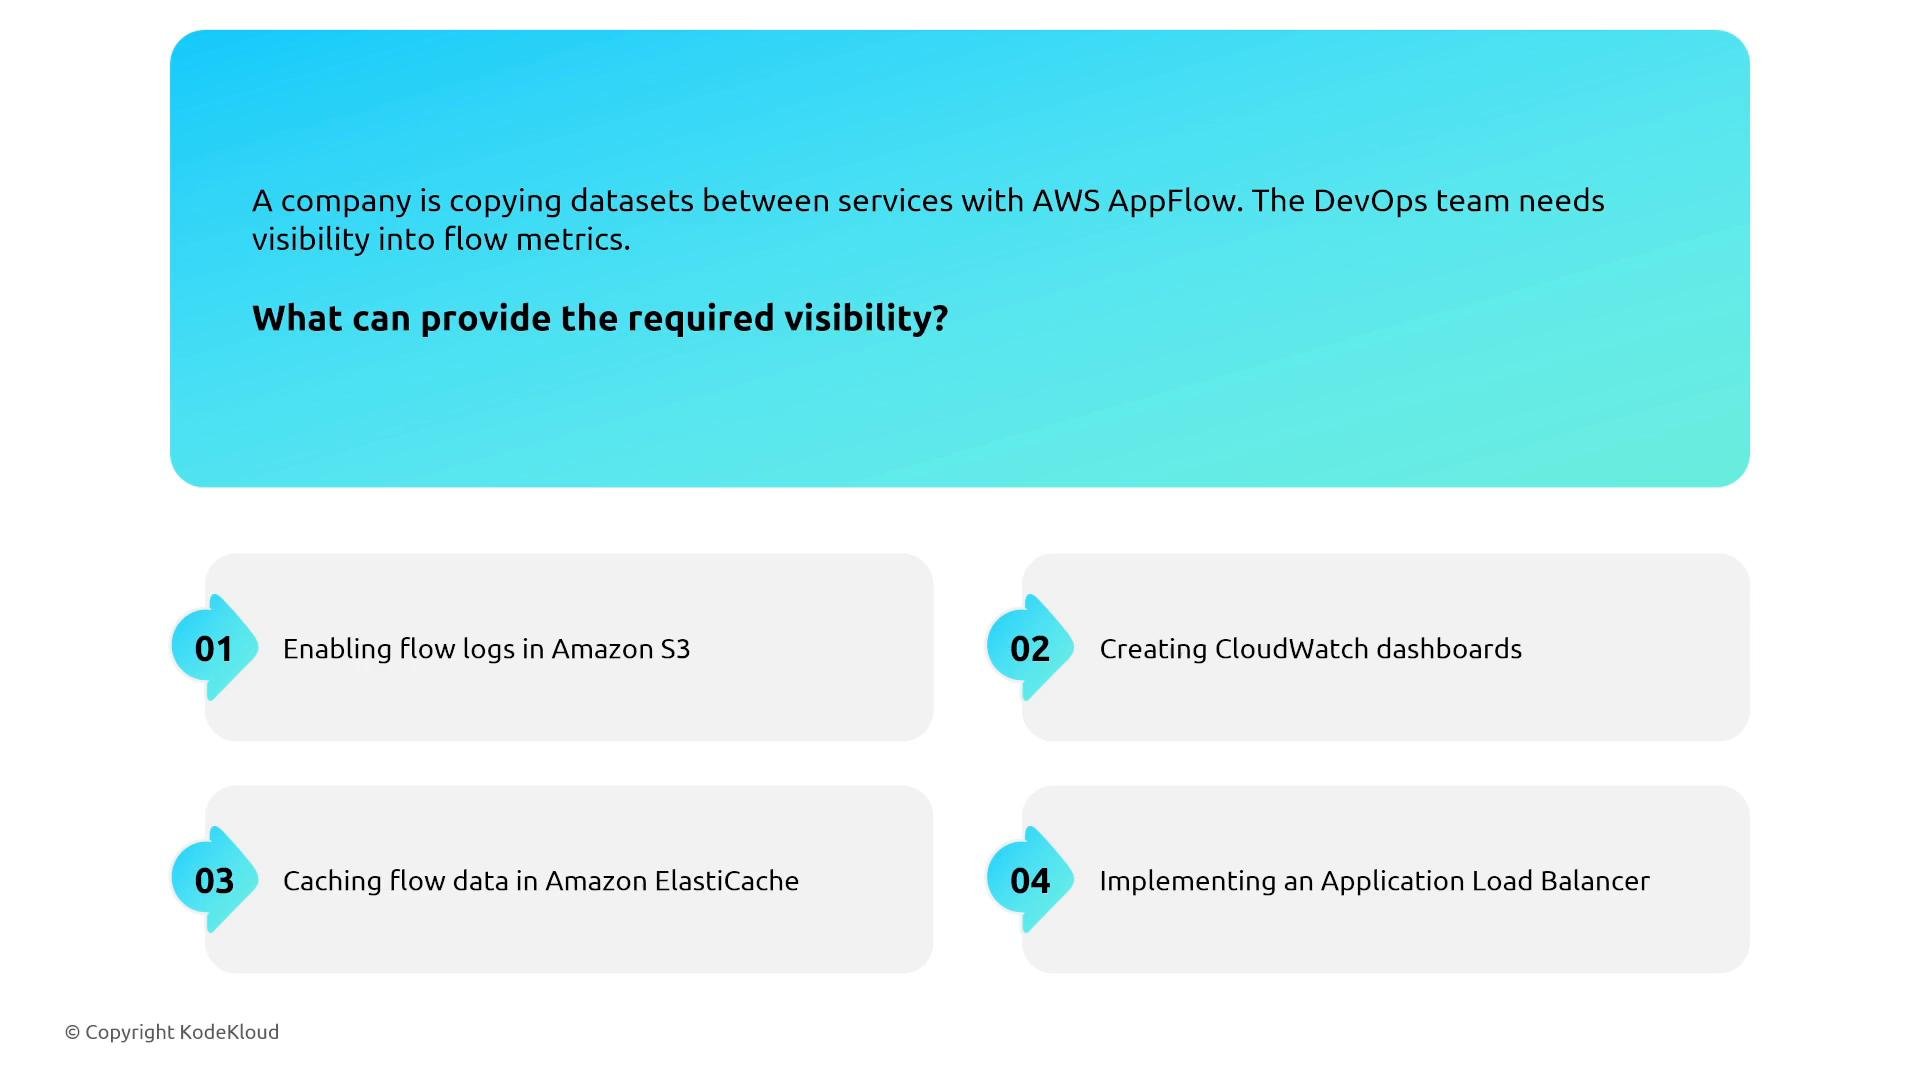
- AppFlow is a managed, highly available data integration service that syncs data between SaaS applications and AWS services with built-in redundancy.
- For visibility, use the AppFlow console and CloudWatch metrics to track flow runs, failures, and throughput. Built‑in redundancy reduces the operational surface and lets you focus on data correctness and monitoring.
Messaging and Events
For resilient, loosely-coupled architectures use a combination of pub/sub, queues, brokered messaging, and event buses. Comparison: SNS, SQS, Amazon MQ, EventBridge
Simple Notification Service (SNS)
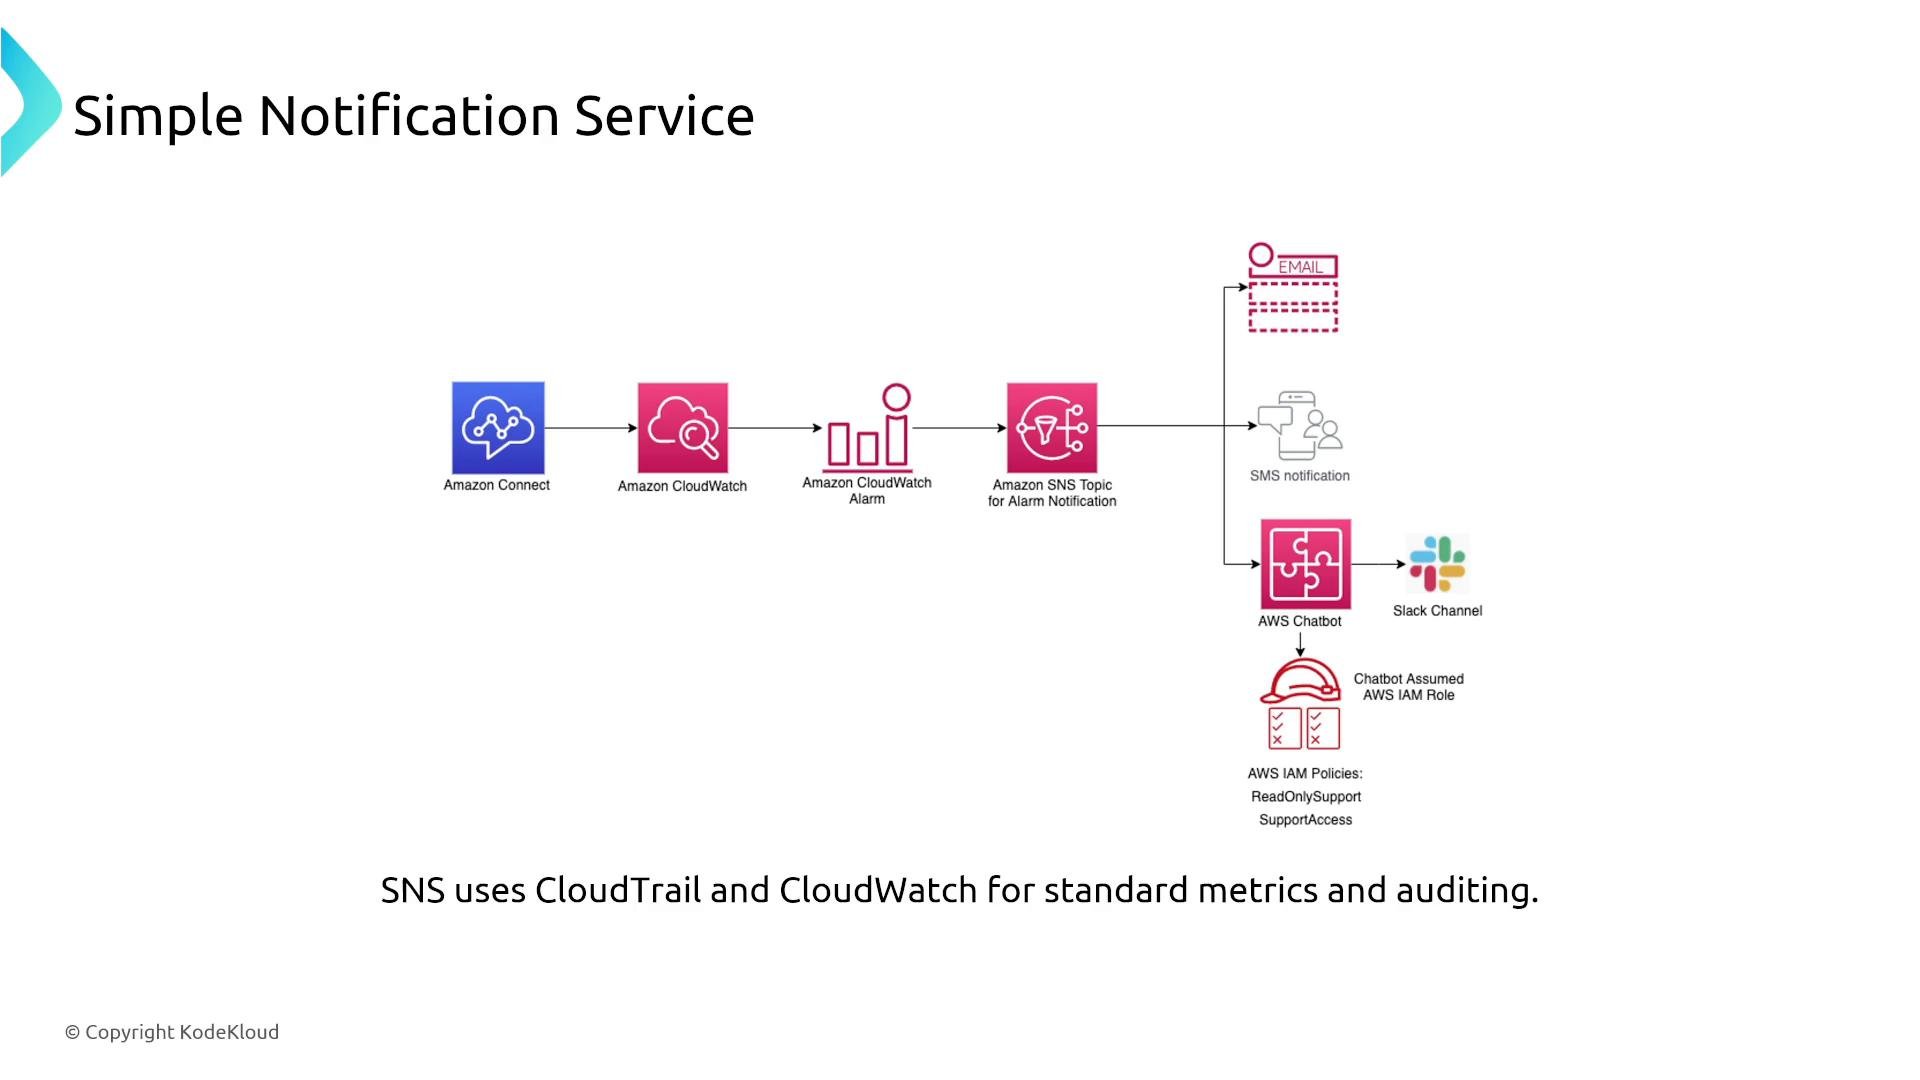
- SNS is a scalable pub/sub service. Use DLQs or integrate with other services to handle undeliverable messages.
- Monitor SNS using CloudWatch metrics (e.g.,
NumberOfMessagesPublished,NumberOfNotificationsDelivered) and use tracing (AWS X-Ray where applicable) to correlate end-to-end flows.
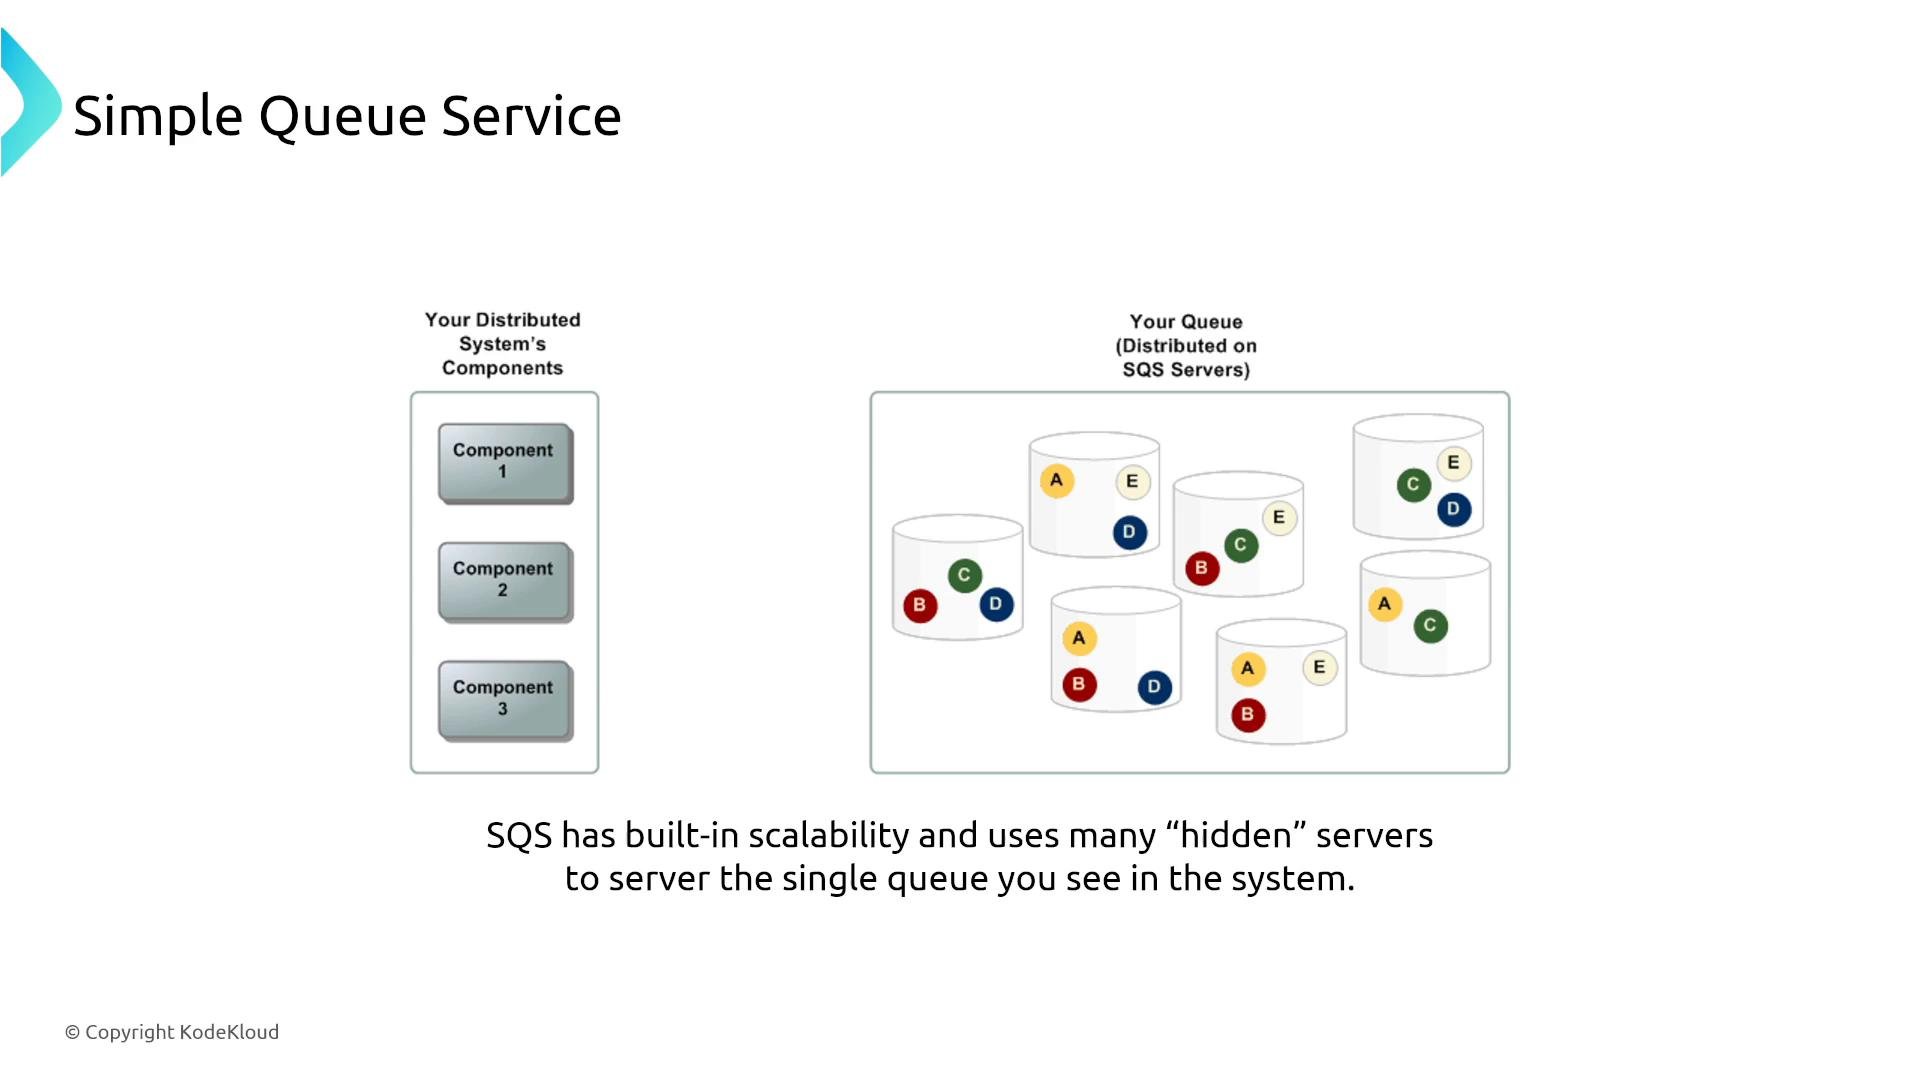
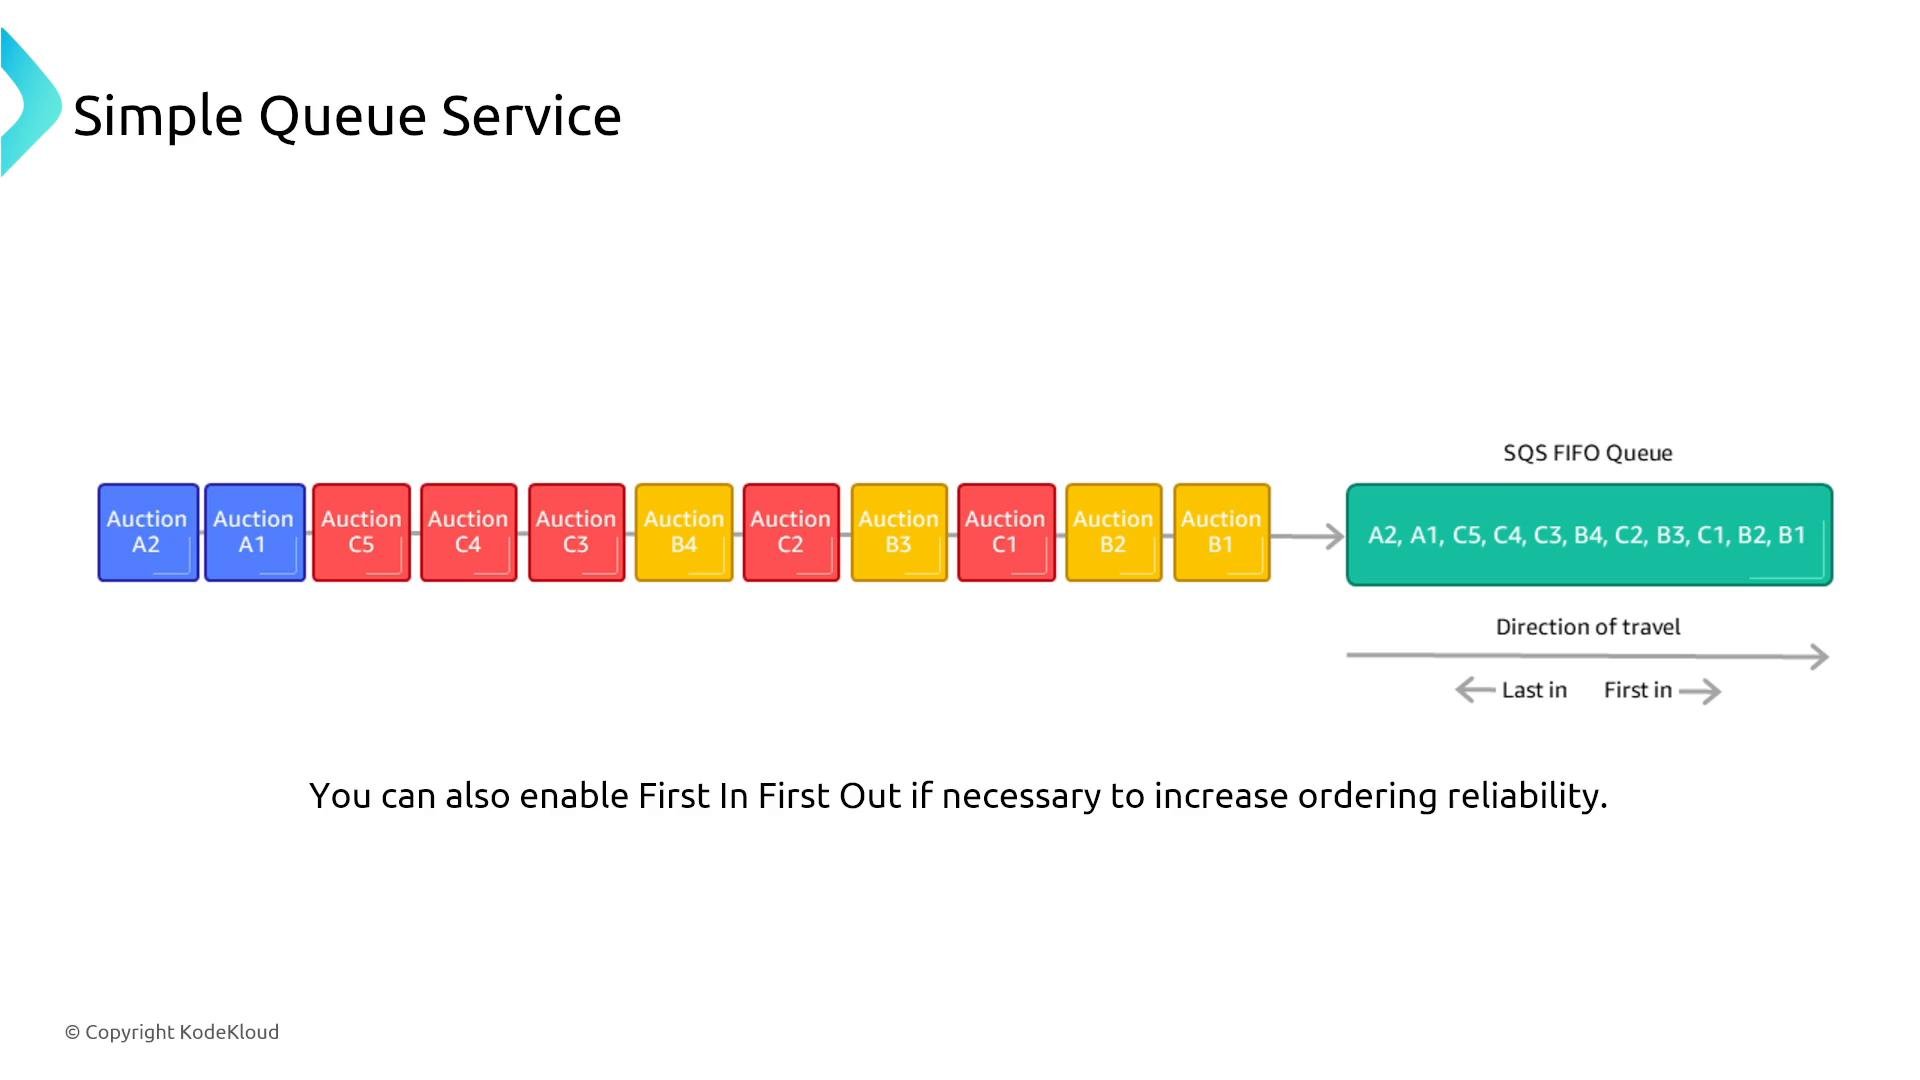
- SQS offers a logical queue surface backed by many servers for durability and scale.
- Use long polling to avoid frequent empty responses — long polling reduces API calls and latency for consumers.
- Visibility timeouts prevent multiple consumers from processing the same message simultaneously. If processing fails, the message becomes visible again after the timeout — enabling at‑least‑once delivery semantics.
- For strict ordering and deduplication use
FIFOqueues (remember throughput characteristics differ from standard queues).
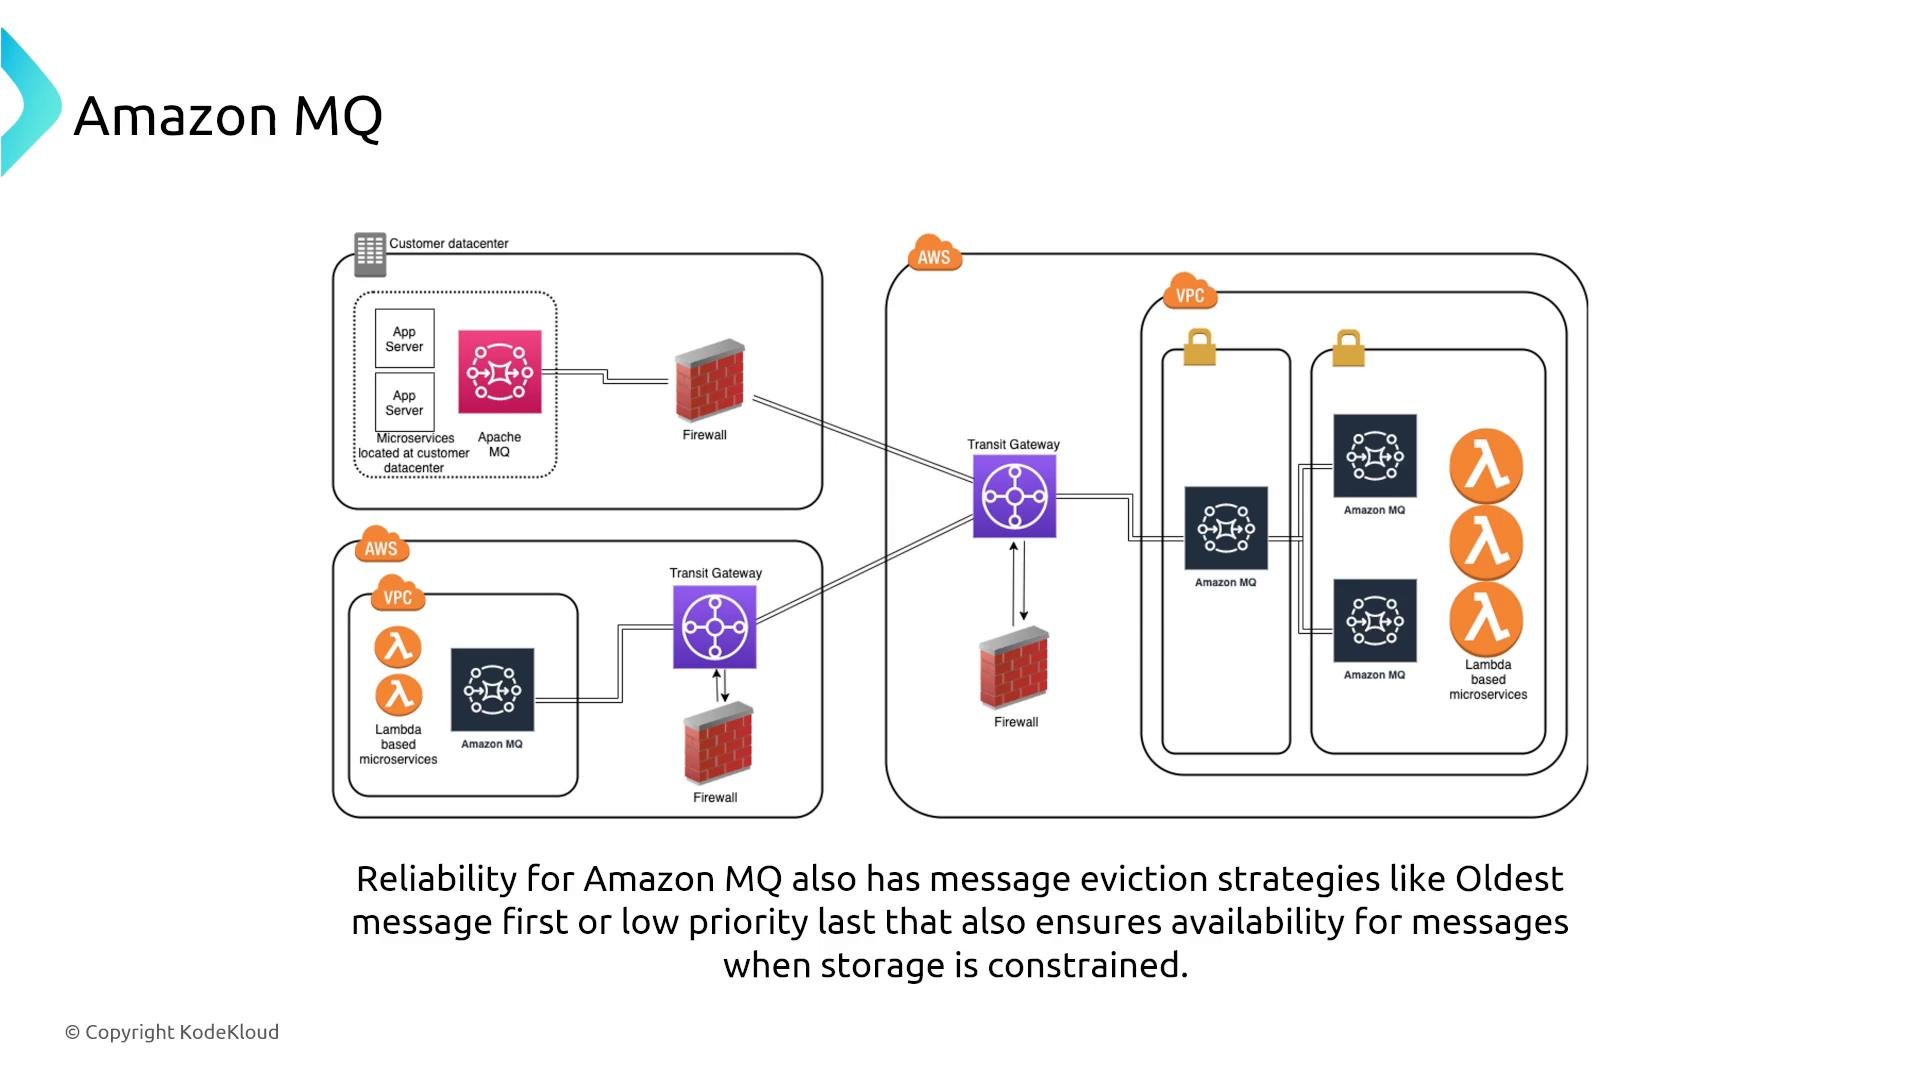
- Amazon MQ provides managed brokers (ActiveMQ, RabbitMQ) and supports standard protocols (AMQP, MQTT, STOMP, JMS).
- For broker reliability, use mirrored queues or clustered brokers to keep message state synchronized across instances.
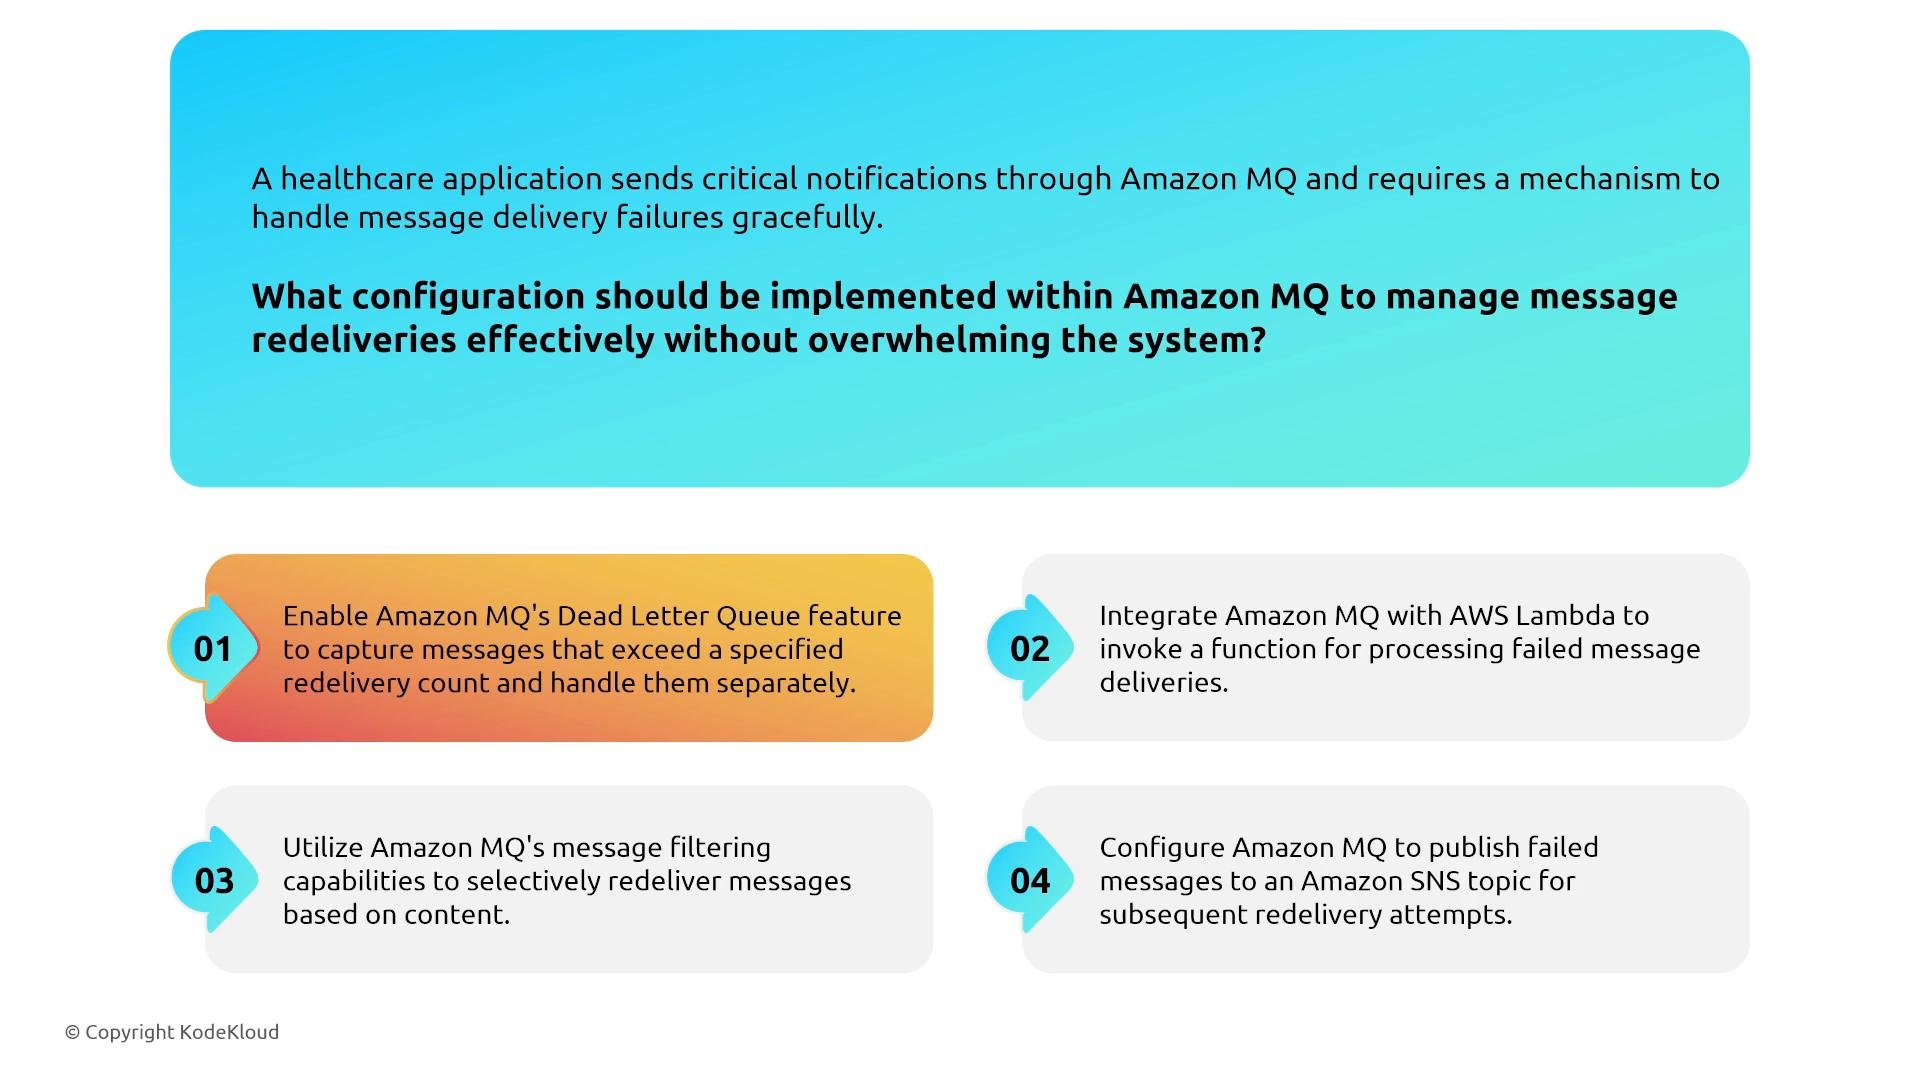
- Configure redelivery policies, priority dispatch, eviction policies, and DLQs to control processing behavior and prevent failed messages from looping indefinitely.
- EventBridge routes events using event patterns and supports filtering, retries, and event replay.
- Prevent noisy or harmful events with fine-grained event patterns and transform events when routing to different targets.
- Use event replay or archive to reprocess events for recovery, backfilling, or testing. Persist events to S3 if you need durable archives for replaying later.
Workflows and Orchestration
Step Functions- Step Functions orchestrate distributed workflows as state machines. Use retries, catchers, exponential backoff, and fallback states to handle transient and persistent failures.
- The console visualizer and CloudWatch metrics provide execution visibility for debugging and operational monitoring.
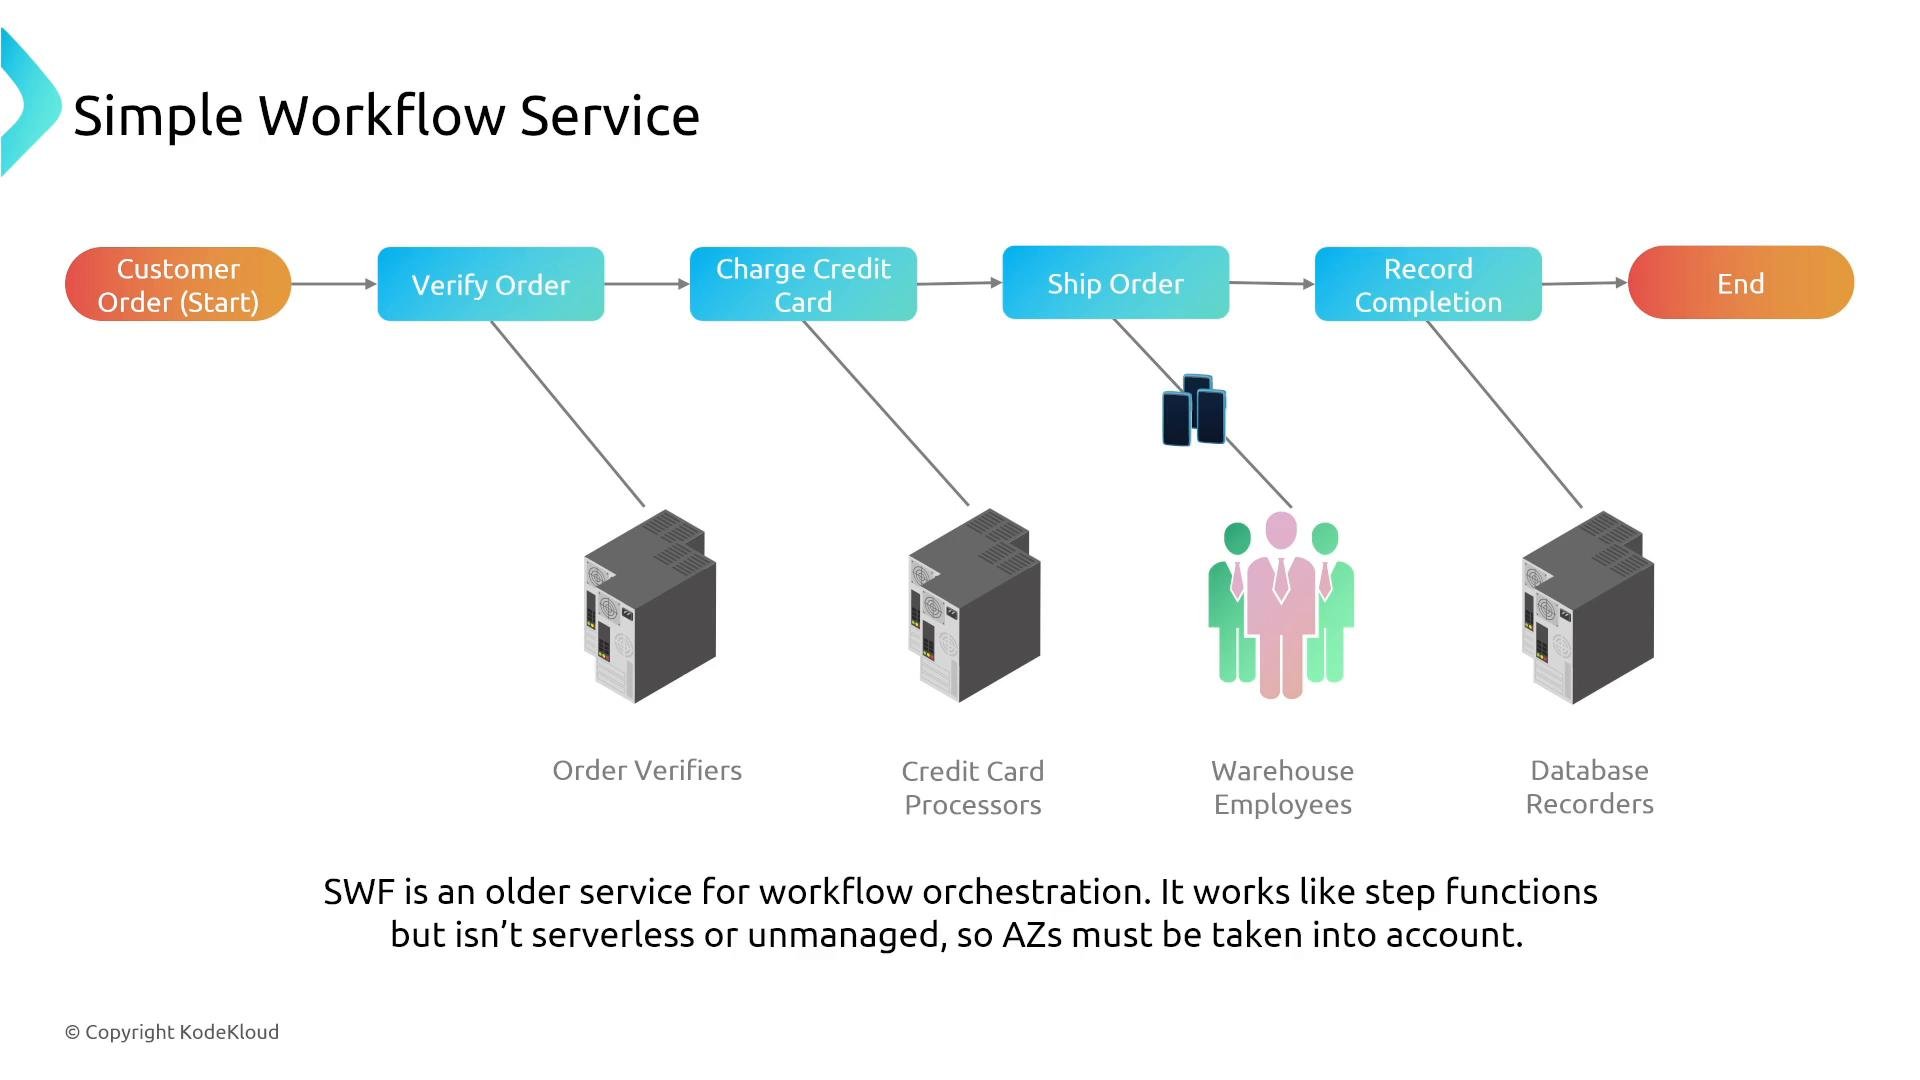
- SWF is an older managed workflow engine where you control worker placement. Run tasks across multiple AZs and configure activity heartbeats to signal progress.
- Use CloudWatch metrics and SWF heartbeats to detect stalled workflows and drive automated remediation.
- MWAA provides managed Apache Airflow with options for Multi‑AZ deployment. Use redundant schedulers and workers, configure task retries, and send logs to CloudWatch for observability.
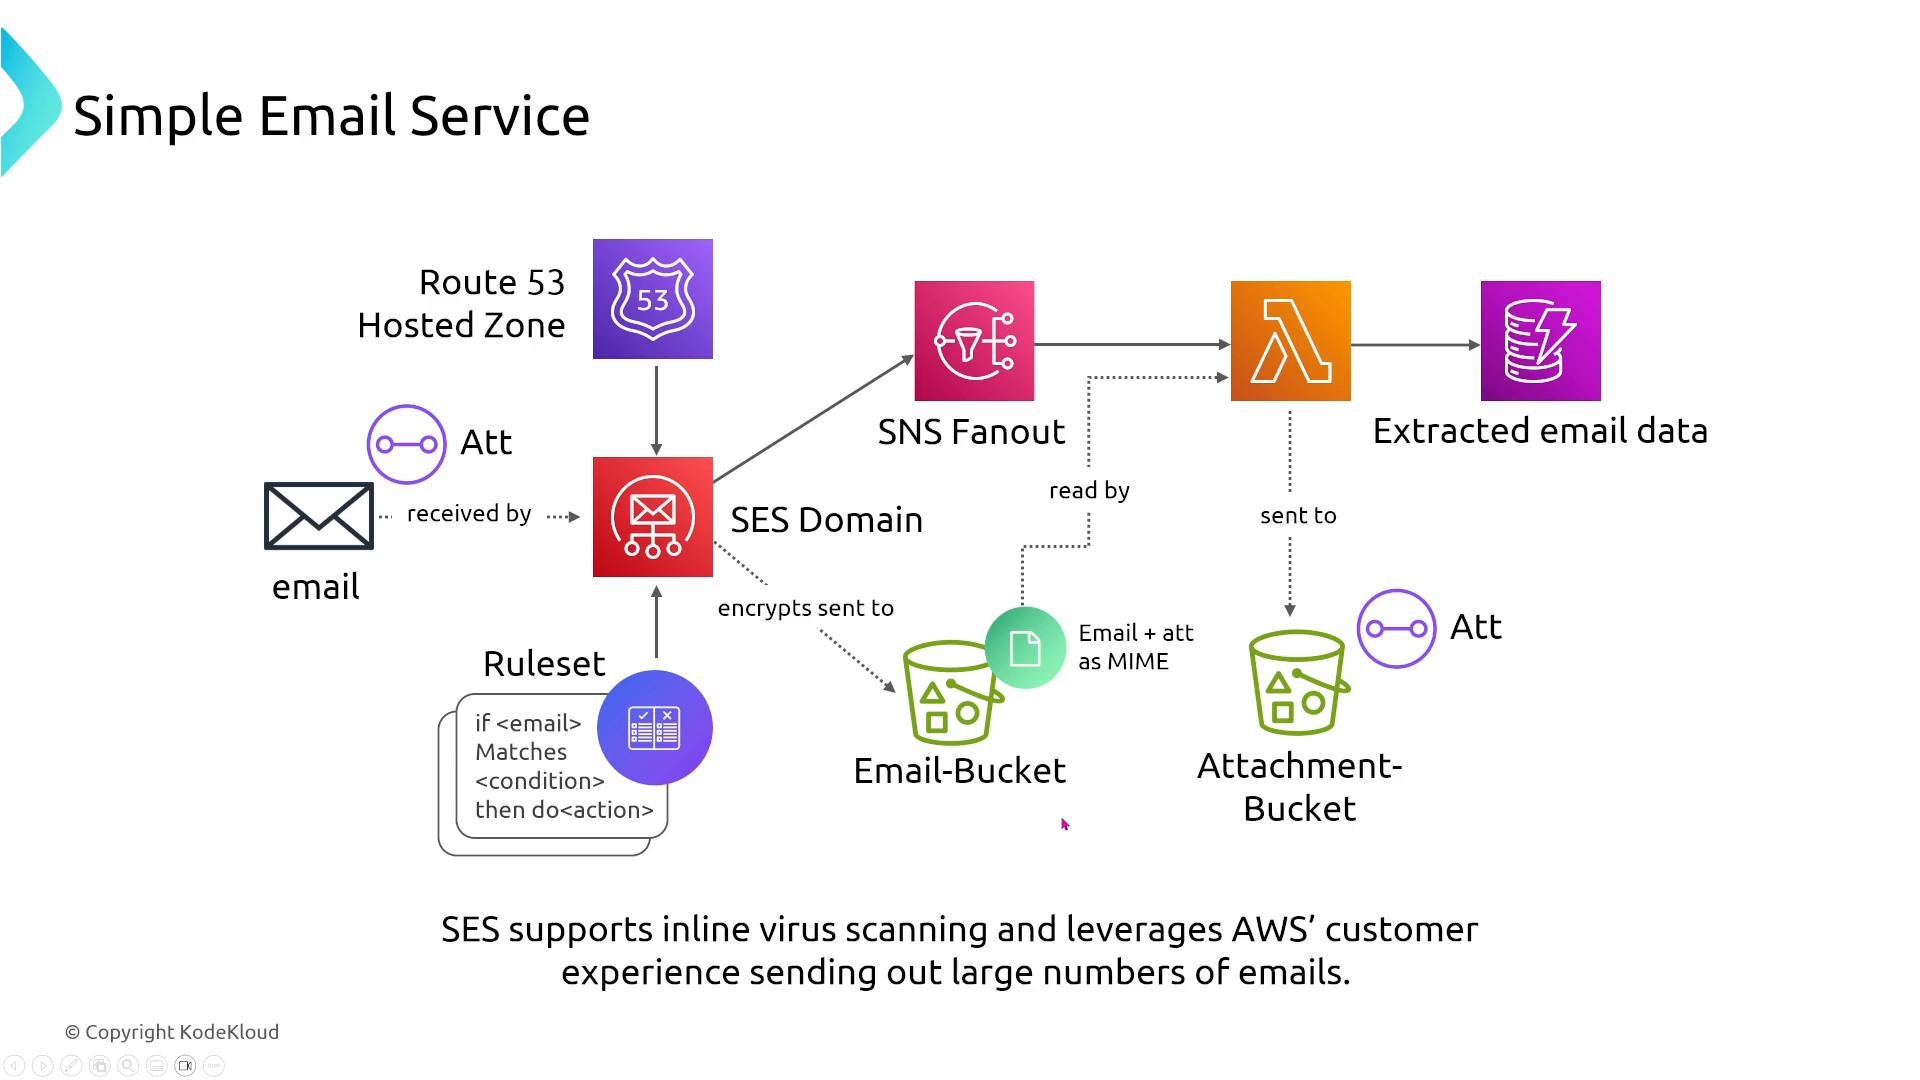
- SES is a managed email platform for sending and receiving mail with deliverability tools and reputation metrics.
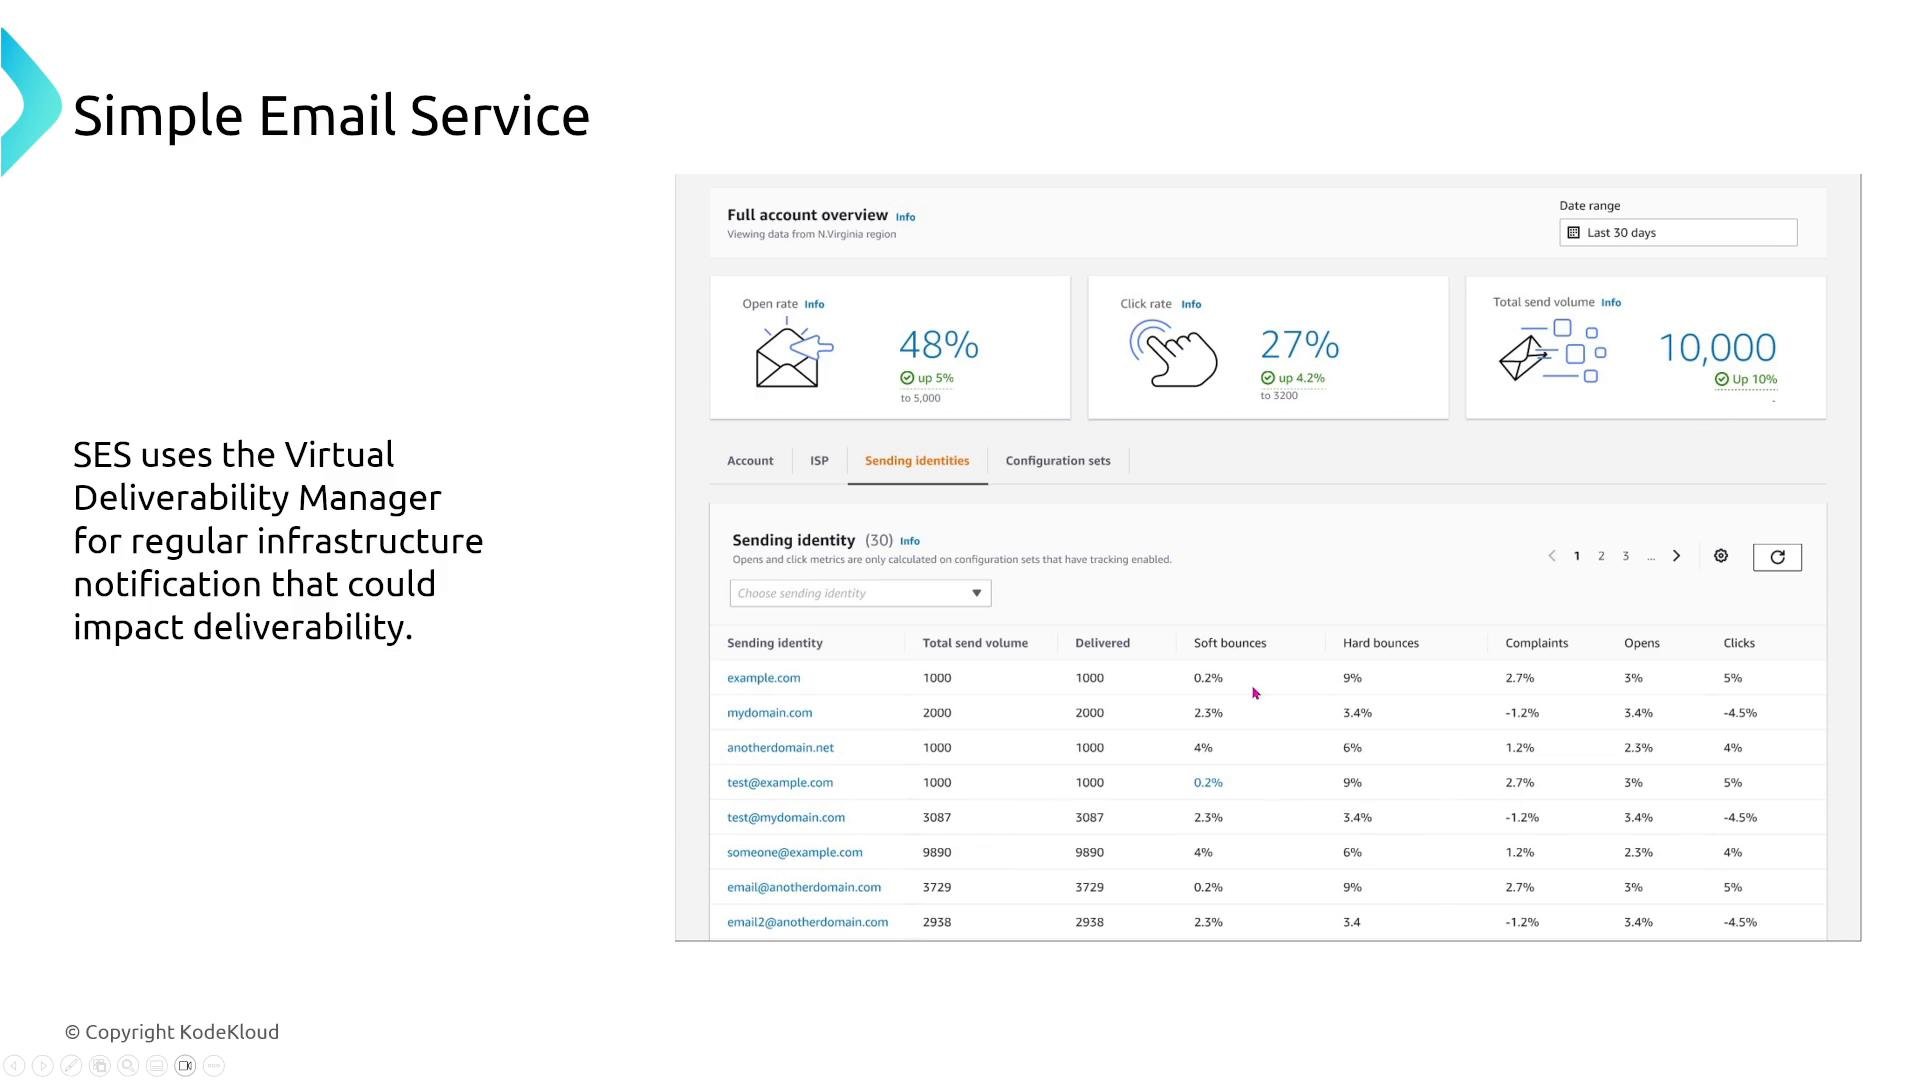
- Use the mailbox simulator and Virtual Deliverability Manager to validate rendering and analyze open/click/delivery rates before large campaigns.
- Integrate SES with SNS, Lambda, and S3 for inbound processing, scanning, and archival.
Summary
- Application integration services are typically highly managed and provide built‑in redundancy. Your primary responsibilities are configuration and architecture: cross‑AZ deployment, proper health checks, autoscaling integration, throttling and canary strategies, DLQs and retries, and comprehensive observability.
- Reliability patterns to apply:
- Distribute across AZs and regions for fault isolation.
- Use health checks and target groups to quickly remove unhealthy nodes.
- Integrate Auto Scaling with load balancers and appliance fleets.
- Employ throttling, circuit breakers, and canary deployments to limit blast radius.
- Use DLQs, retries with backoff, and event replay to recover from failures.
- Centralize logs and metrics (CloudWatch, access logs, VPC Flow Logs) for rapid detection and remediation.
- Loose coupling — via queues, topics, and API front ends — helps isolate failures and enables graceful recovery.