This article provides a comprehensive demo of AWS CloudWatch, showcasing its features for monitoring AWS environments, including logs, metrics, alarms, and dashboards.
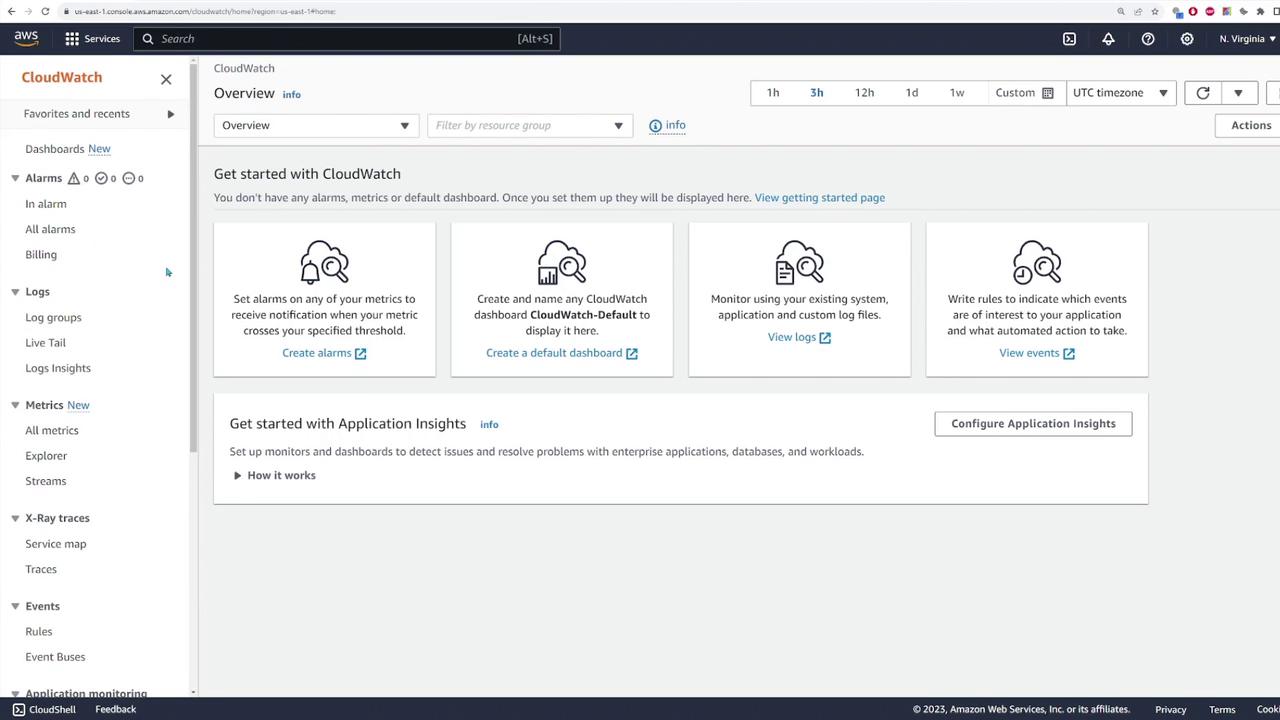
In this article, we walk through a comprehensive demo of AWS CloudWatch, highlighting its key features and functionalities for monitoring your AWS environment. CloudWatch is more than just a single service—it’s a suite of monitoring tools that manage logs, metrics, alarms, dashboards, and more.To begin, access CloudWatch by searching for the service in the AWS console. Once on the CloudWatch page, explore the various features available on the left-hand panel. Each feature provides distinct capabilities for monitoring and managing your AWS resources.
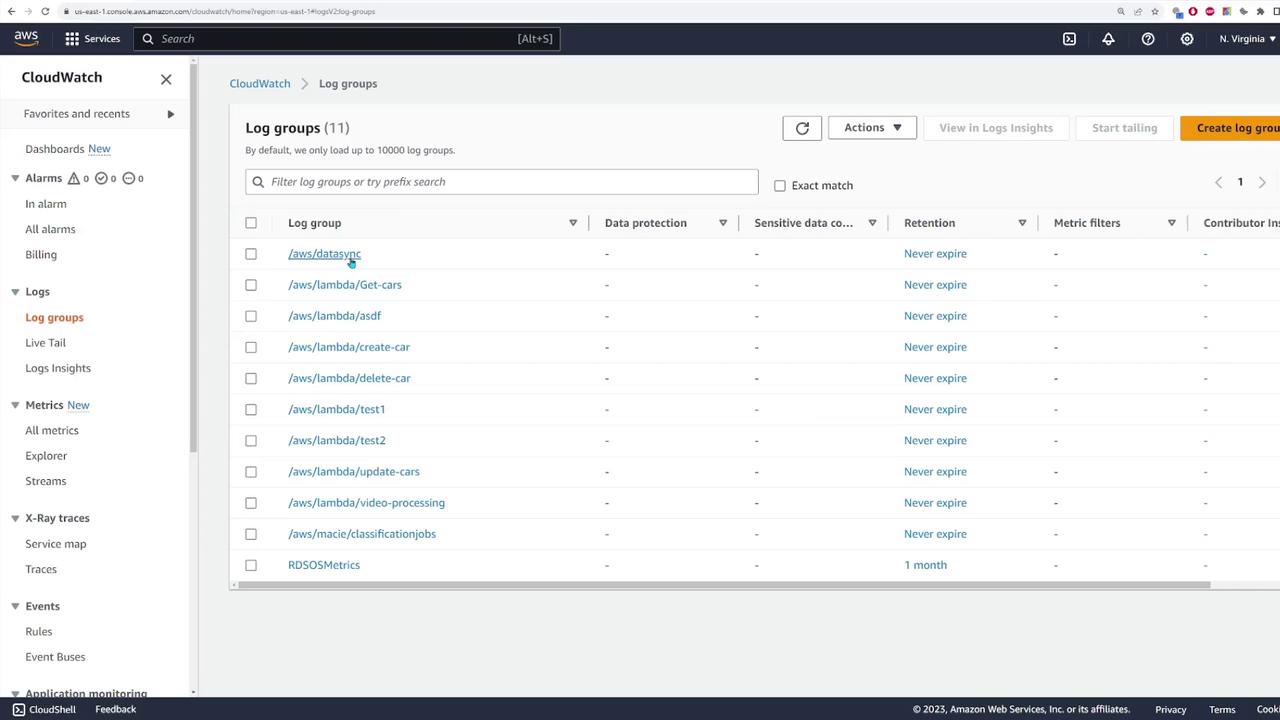
CloudWatch’s centralized log management lets you collect and analyze logs from different services and applications across your AWS account. Logs are organized into log groups based on your configurations or the specific service/resource generating them. This means you can have distinct log groups for your DataSync operations, each Lambda function, or services like AWS Macie.
Within each log group, inspect individual log streams. For example, when you navigate to the logs of a Lambda function (e.g., “test one”), you’ll notice several log streams that include timestamps of the last events. Selecting a log stream reveals detailed log data such as initialization messages, invocation details, and function output.
This snippet shows detailed Lambda output, capturing events from a DynamoDB stream. Each new invocation generates similar log entries.For example, Macie logs contain job event details:
{ "adminAccountId": "841860927337", "jobId": "89bfa2335cdea88b3c1d38d78c12c", "eventType": "JOB_CREATED", "occurredAt": "2023-10-17T01:06:24.566653Z", "description": "The job was created.", "jobName": "macie-test-job"}
{ "adminAccountId": "841860927337", "jobId": "89bfa2335cdea88b3c1d38d78c12c", "eventType": "ONE_TIME_JOB_STARTED", "occurredAt": "2023-10-17T01:06:29.618922Z", "description": "The job started running."}
CloudWatch also features a live tail mechanism for real-time troubleshooting. By selecting a specific log group (e.g., the “test one” Lambda group) and activating live tailing, you can stream new log entries as soon as they are generated. Running tests on your Lambda function will produce outputs similar to the following:
START RequestId: 78d5a620-3f88-4ed2-aec1-150ee81539ae Version: $LATEST2023-10-19T01:20:54.405Z 78d5a620-3f88-4ed2-aec1-150ee81539ae INFO Records: [ { eventID: 'c4c4a238abf923820dc509a67f549b', eventName: 'INSERT', eventVersion: ...END RequestId: 78d5a620-3f88-4ed2-aec1-150ee81539aeREPORT RequestId: 78d5a620-3f88-4ed2-aec1-150ee81539ae Duration: 116.26 ms Billed Duration: 117 ms Memory Size: 128 MB Max Memory Used: 69 MB
This live tail feature is invaluable for immediate insights during troubleshooting, allowing you to quickly pinpoint issues as they occur.
CloudWatch Log Insights provides a powerful query language similar to SQL, enabling you to filter and analyze logs efficiently. For instance, you can execute the following query to list the 20 most recent log entries:
The query output displays a graph of log events over time alongside detailed log entries that match the criteria. You can modify the query to sort entries in ascending order and reduce the limit, as shown below:
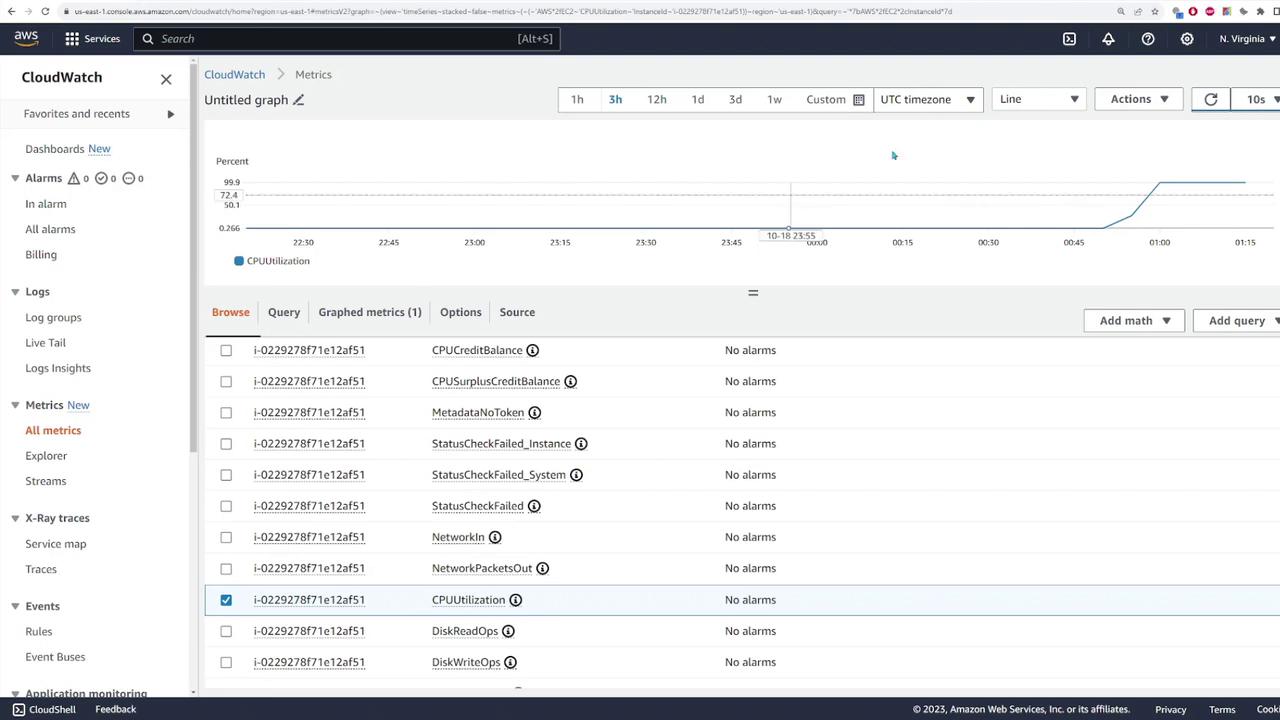
CloudWatch collects a variety of metrics for your AWS resources. To view these metrics, navigate to the “All Metrics” section. You can filter metrics by service; for example, EC2 metrics include CPU utilization, status checks, network traffic, and EBS operations.Consider the following example for monitoring CPU utilization of an EC2 instance:
In this graph, you can observe periods of minimal usage and sudden spikes. Customize the display by adjusting the time range (e.g., last hour or three hours) or by choosing different visualization formats.
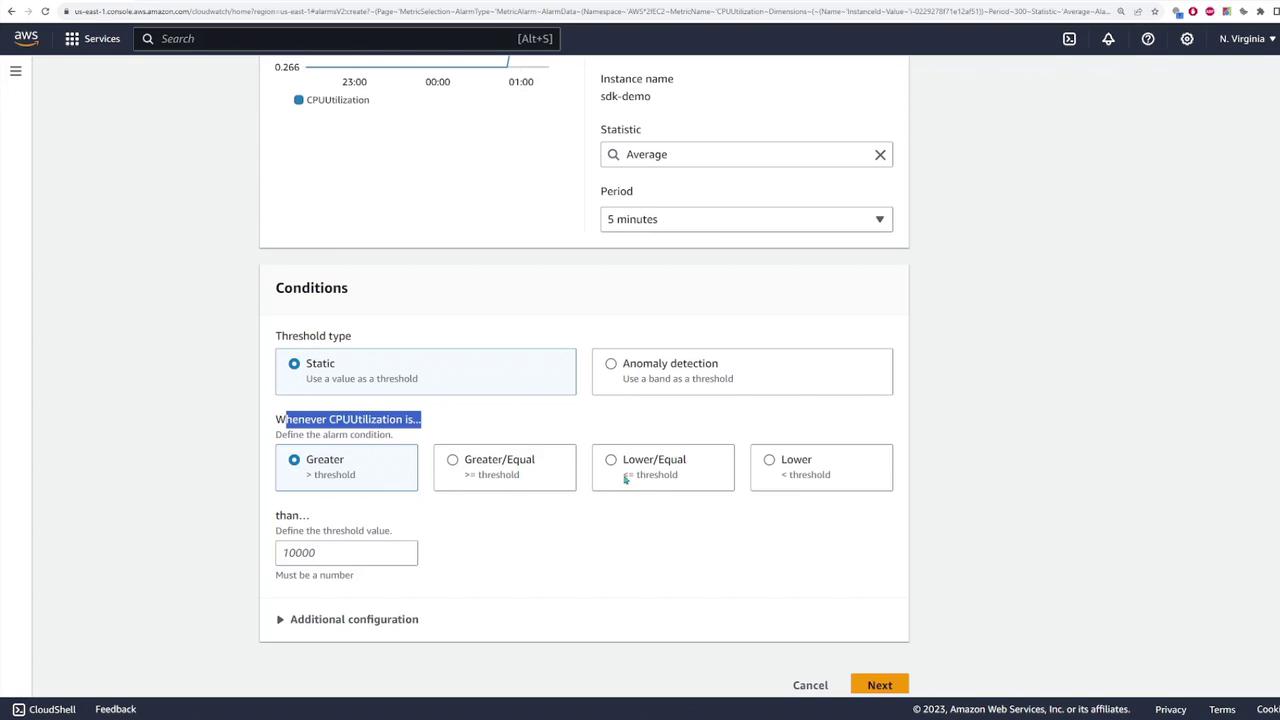
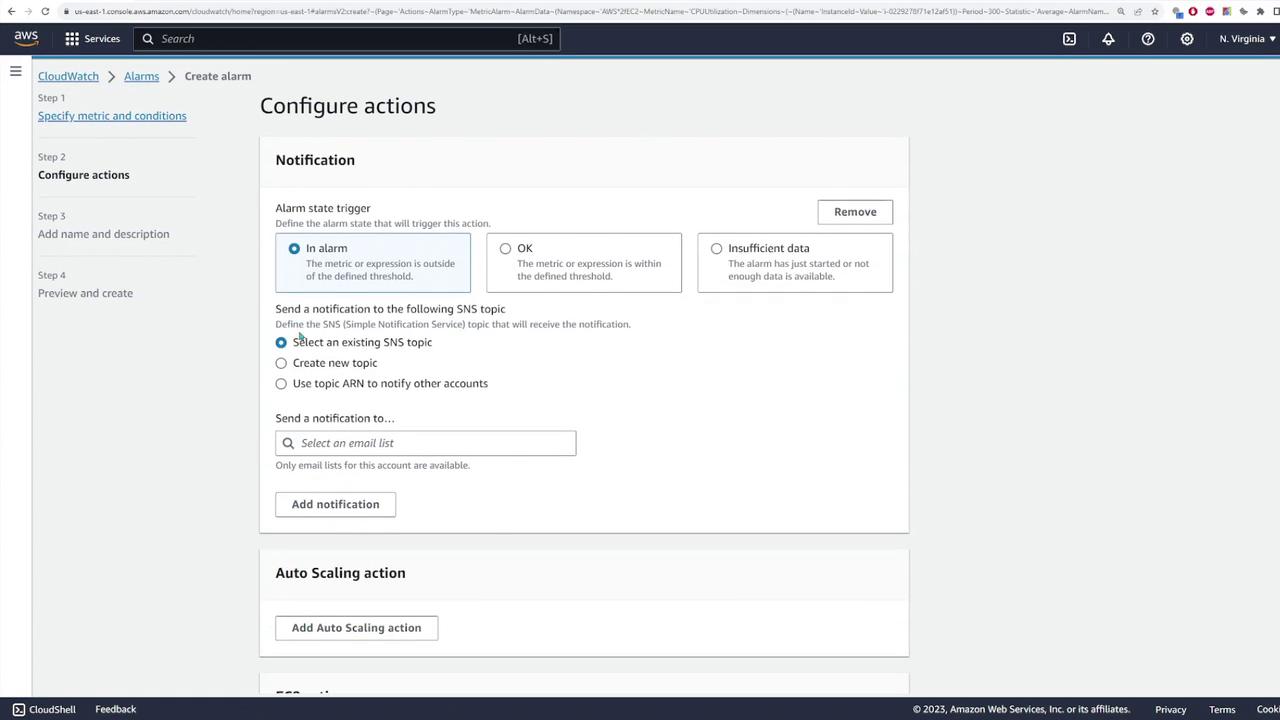
CloudWatch alarms allow you to monitor specific metrics and trigger notifications when thresholds are exceeded. For instance, you can create an alarm for CPU utilization. When the average CPU usage exceeds a predefined static threshold—say 60% over a five-minute period—an alarm is triggered.
After selecting the metric, configure the alarm conditions, and ensure notifications are sent via an SNS topic (such as an email alert). This setup guarantees that any sustained high CPU usage triggers an alert to the designated recipients.
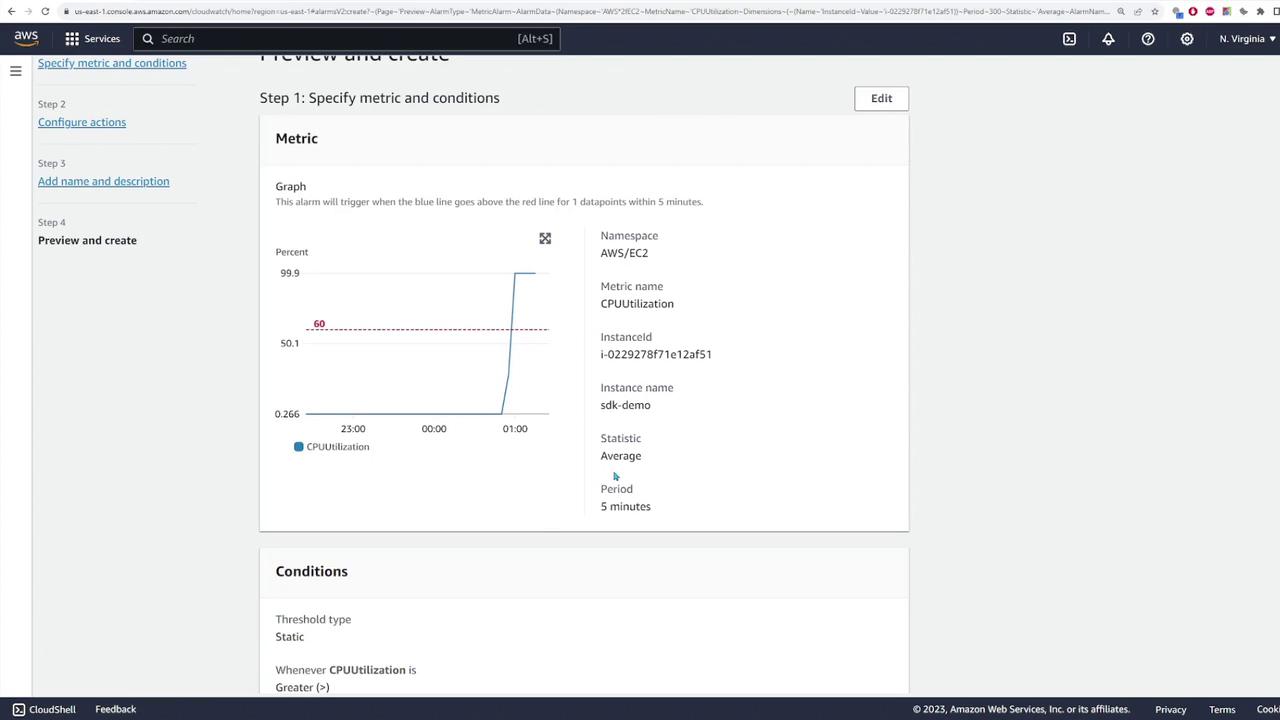
Verify your settings with the corresponding graph display. If everything is in order, save your configurations; otherwise, cancel the setup if modifications are needed.
Dashboards in CloudWatch let you assemble metrics and logs into customizable visual displays. Creating a dashboard is straightforward:
Navigate to the “Dashboards” section and click “Create dashboard.”
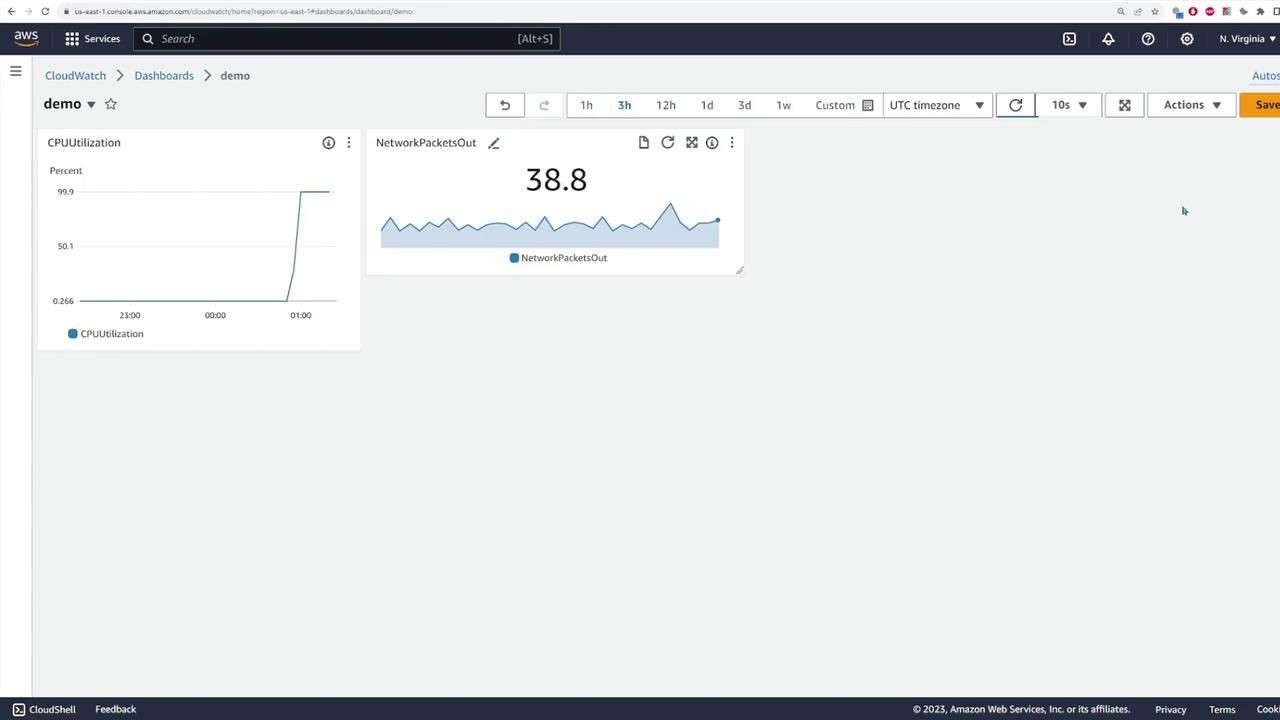
Name your dashboard (e.g., “demo”) and add various widgets:
Metric Widgets: Insert a line graph for CPU utilization by selecting the corresponding metric.
Numeric Widgets: Include widgets that showcase numerical data, such as the number of network packets sent.
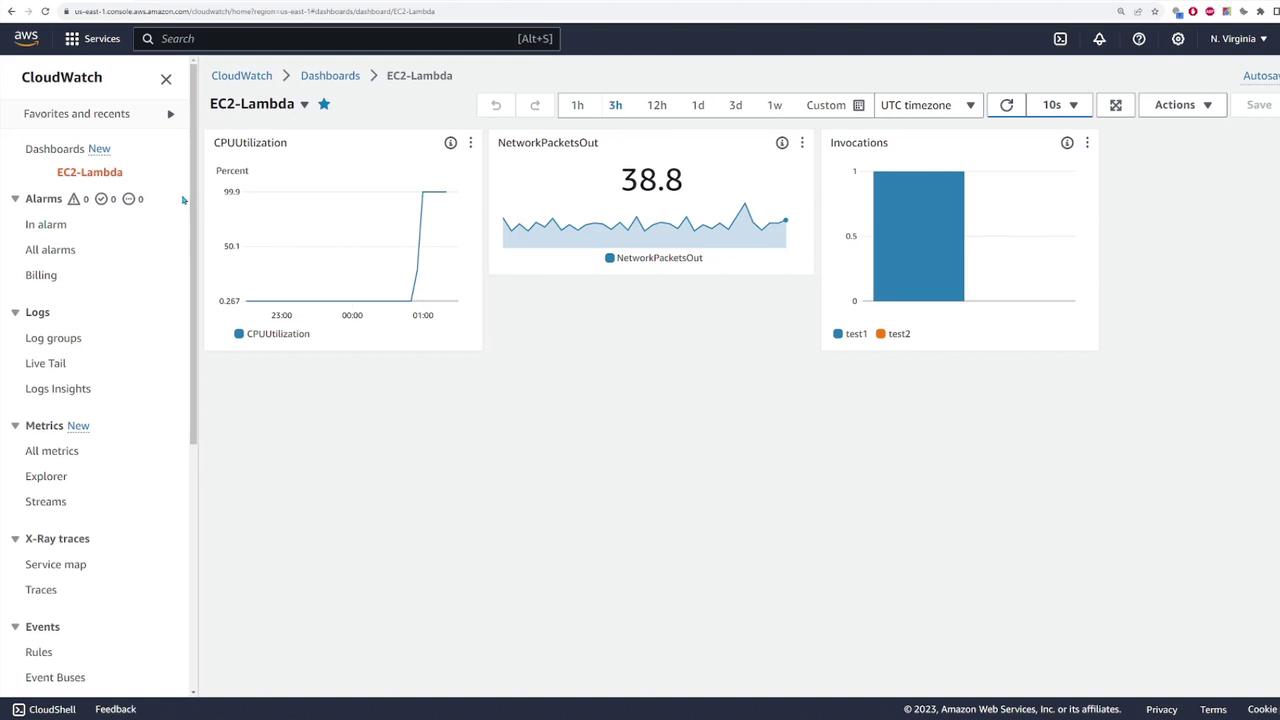
Lambda Invocation Metrics: Display the number of invocations for your Lambda functions.
Resize and rearrange the widgets as needed to optimize the layout.
Once satisfied with the layout, save your dashboard under an appropriate name. Use multiple dashboards to monitor different environments or teams, such as separate dashboards for ECS clusters or individual applications.
This overview of CloudWatch has covered log management, live tailing, log insights, metrics, alarms, and dashboards. Experiment with these features to tailor your AWS monitoring strategy to your specific requirements.Happy monitoring!