

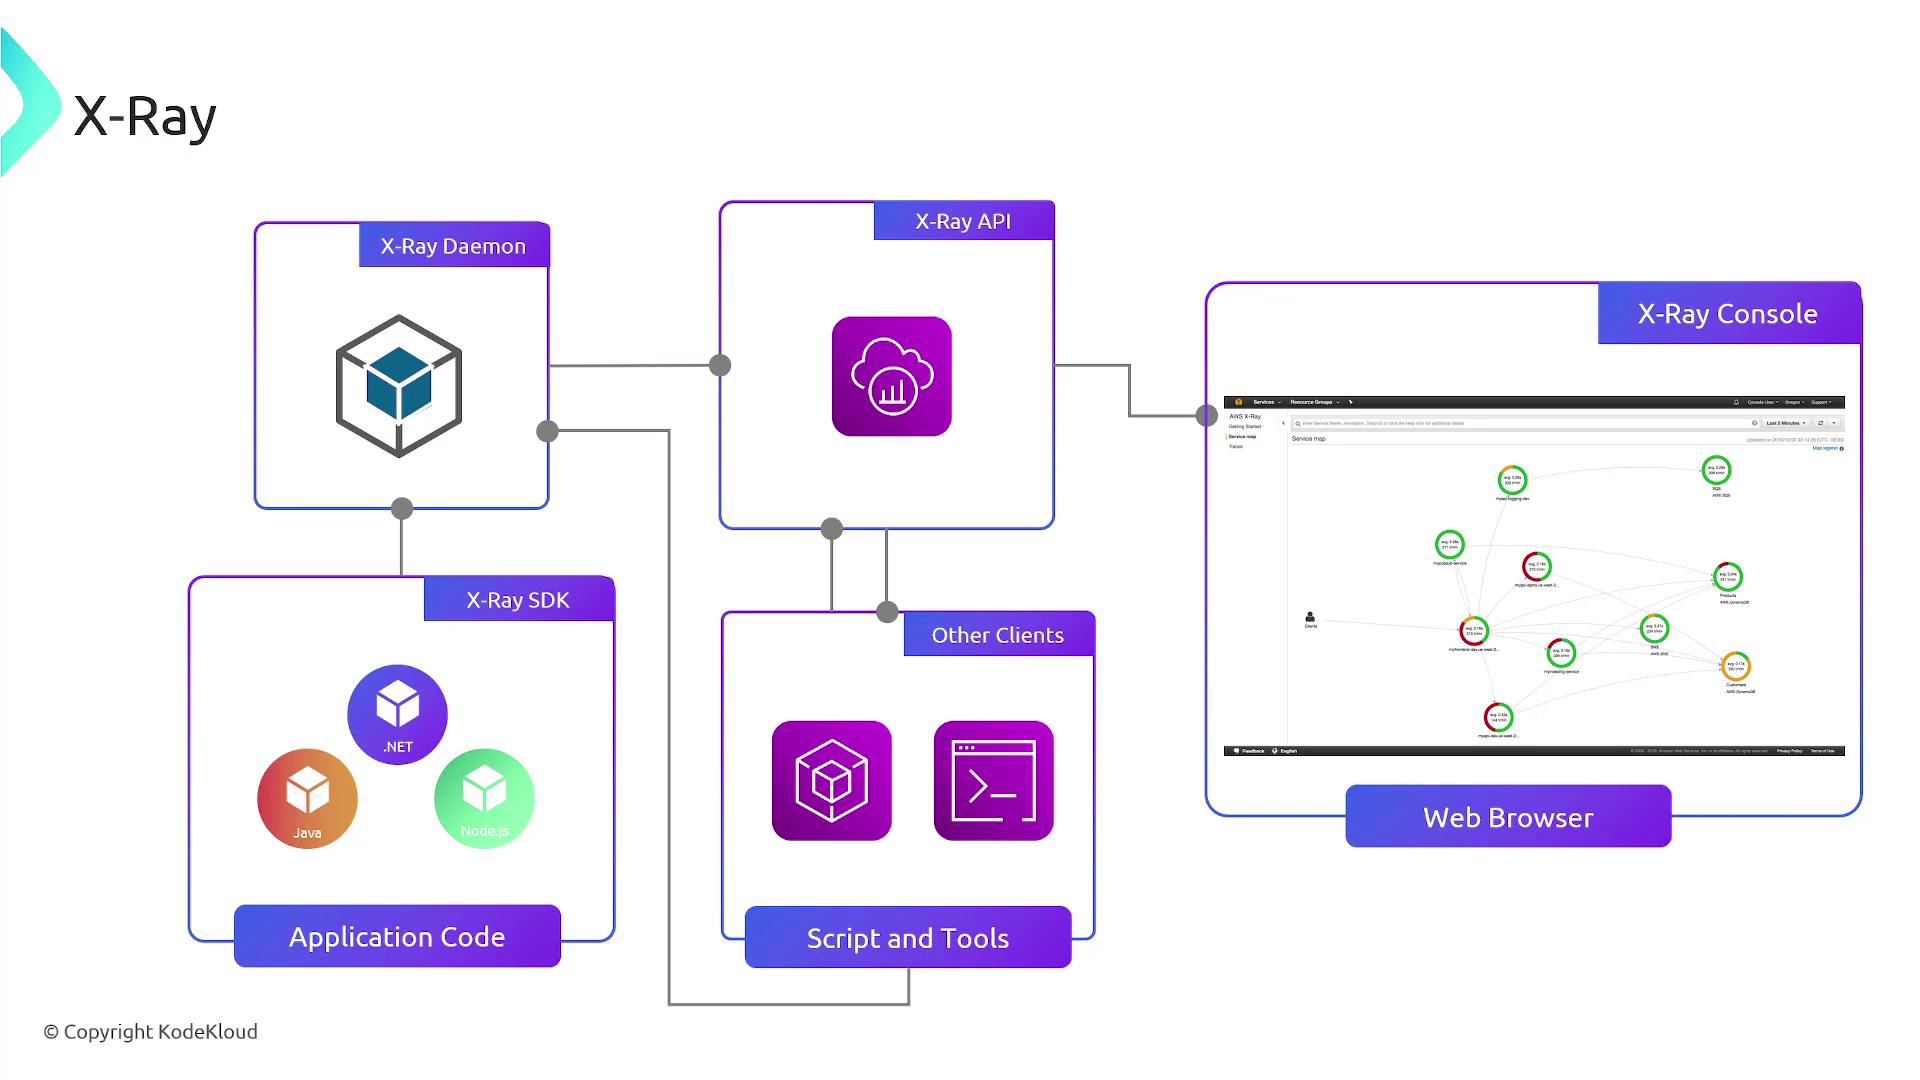
Overview of AWS X-Ray
AWS X-Ray is a tracing tool that collects detailed data about the requests made by your application. It captures not only your application’s internal processes but also its interactions with various AWS services such as RDS, DynamoDB, and others. By breaking down each request into detailed segments, X-Ray enables you to monitor timing, status indicators, and performance metrics across the entire call chain.Every incoming request is recorded as a trace—a collection of segments that chronicle the complete journey of that request through your distributed system.
How X-Ray Works
Consider a scenario where a user initiates a login request. AWS X-Ray logs the entire process by splitting it into segments. For example:- The request enters the application, reaches an endpoint, and returns a 200 status code in 118 milliseconds.
- The application then interacts with an RDS database to process the login, taking 105 milliseconds with a status code of 200.
- Lastly, the request continues to an S3 bucket for file storage, which takes 88 milliseconds.
When diagnosing performance issues, ensure you analyze the complete trace. Missing any segment in the analysis might lead to an incorrect conclusion about the root cause.
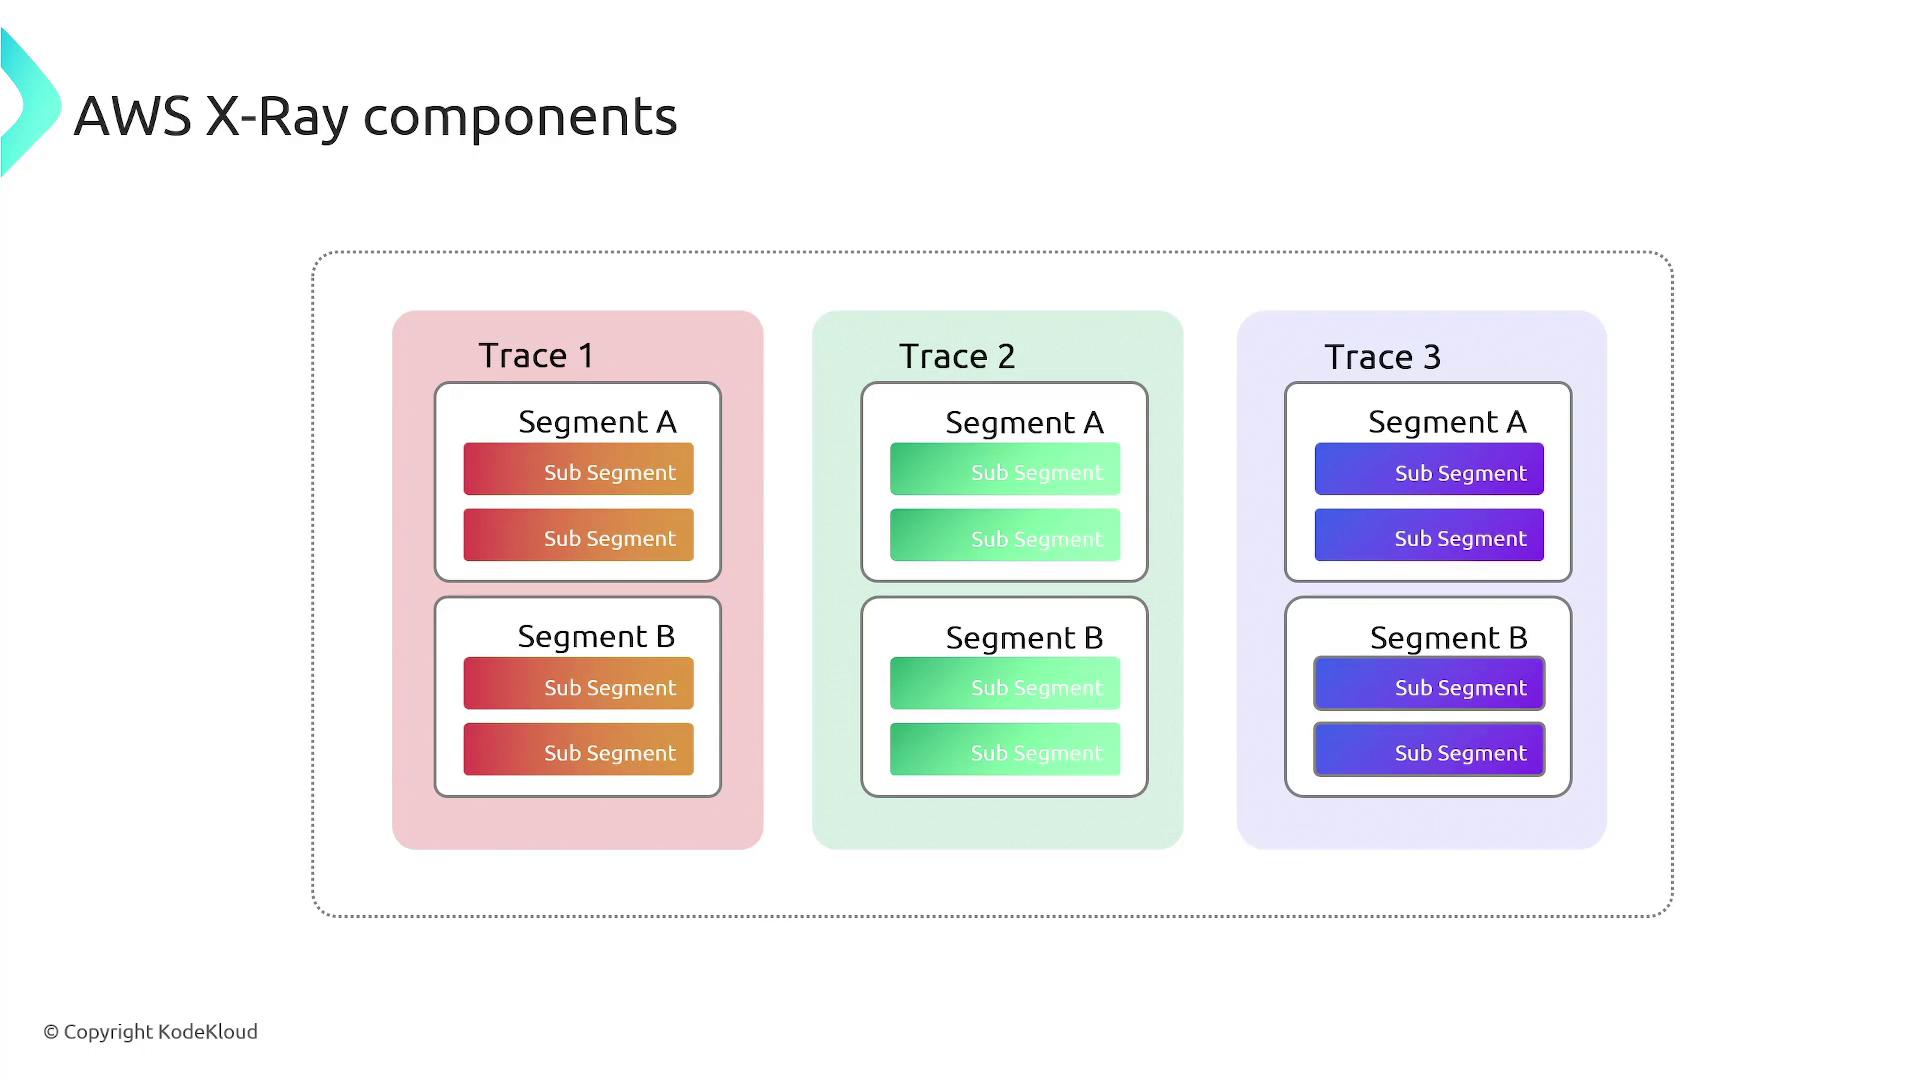
Key Concepts of X-Ray
This structured breakdown of application requests is the primary advantage of AWS X-Ray. It not only simplifies the process of identifying and resolving performance issues but also provides a clear visual representation of how different components interact across your distributed system.
AWS X-Ray is an essential tool for developers and architects aiming to enhance application performance and reliability. By utilizing the detailed trace data provided by X-Ray, you can quickly detect unusual delays, understand the flow of complex requests, and optimize the overall performance of your cloud-based applications.